SOM cluster: 183
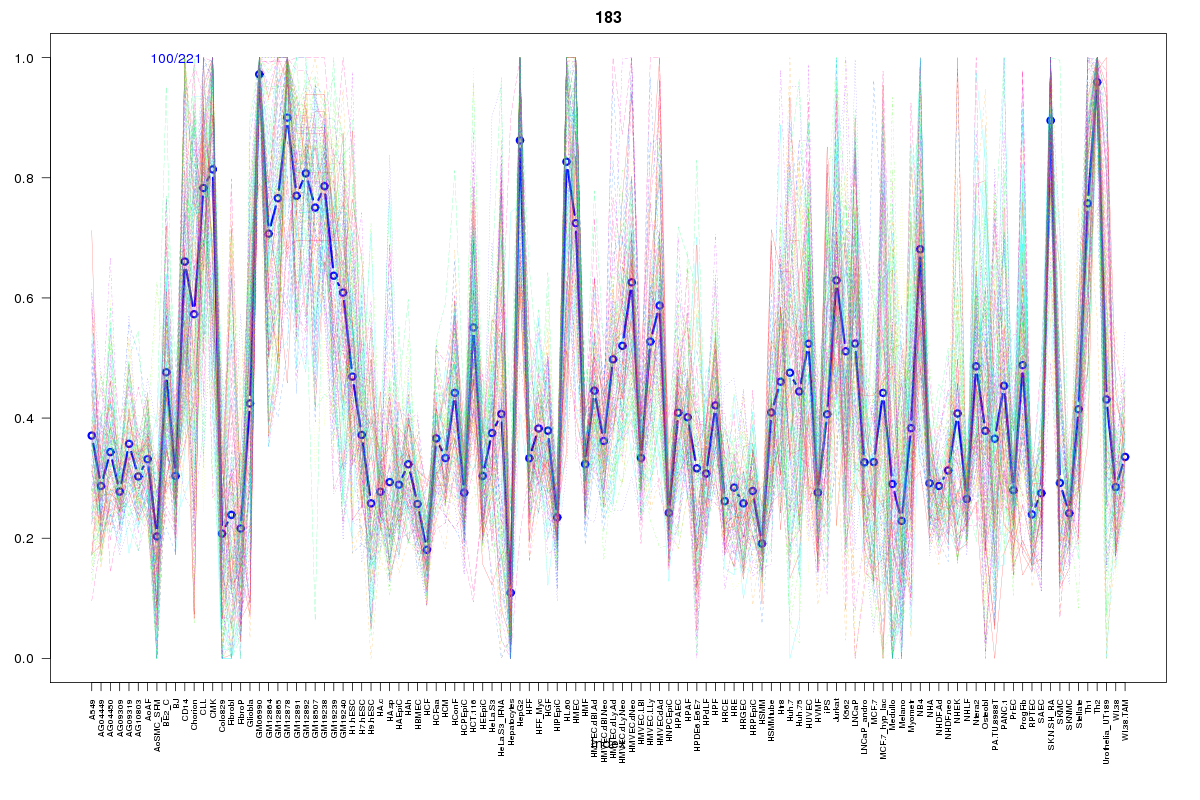
Cluster Hypersensitivity Profile

Genomic Location Trend
These plots show the distribution of the DHS sites surrounding the Transcript Start Site of the nearest gene.
Stats
Number of sites: 221Promoter: 38%
CpG-Island: 98%
Conserved: 74%
Enriched Motifs & Matches
Match Detail: [Jaspar]
|
| ||
|---|---|---|
| Sites: 92/100 | e-val: 0 | ||
| Factor | e-val(match) | DB |
| TFAP2A | 0.00093877 | JASPAR |
| Zfx | 0.0038759 | JASPAR |
| SP1 | 0.0096108 | JASPAR |
| Egr1 | 0.010492 | JASPAR |
| NHLH1 | 0.035459 | JASPAR |
|
| ||
| Sites: 93/100 | e-val: 6.7e-32 | ||
| Factor | e-val(match) | DB |
| TFAP2A | 0.000016732 | JASPAR |
| SP1 | 0.00031506 | JASPAR |
| PLAG1 | 0.0014749 | JASPAR |
| Zfx | 0.011206 | JASPAR |
| NHLH1 | 0.013625 | JASPAR |
BED file downloads
Top 10 Example Regions
| Location | Gene Link | Dist. |
|---|---|---|
| chr17: 62962020-62962170 | GNA13 | 34.72 |
| chr1: 171711380-171711530 | RP4-560B9.4 | 44.8 |
| chr1: 171711380-171711530 | METTL13 | 44.8 |
| chr1: 171711380-171711530 | MYOC | 44.8 |
| chr1: 171711380-171711530 | DNM3 | 44.8 |
| chr1: 762980-763130 | LINC01128 | 45.51 |
| chr1: 202858045-202858195 | RP11-38O14.5 | 49.24 |
| chr9: 33167605-33167755 | BAG1 | 51.45 |
| chr9: 33167605-33167755 | SMU1 | 51.45 |
| chr9: 33167605-33167755 | RP11-326F20.5 | 51.45 |