SOM cluster: 1829
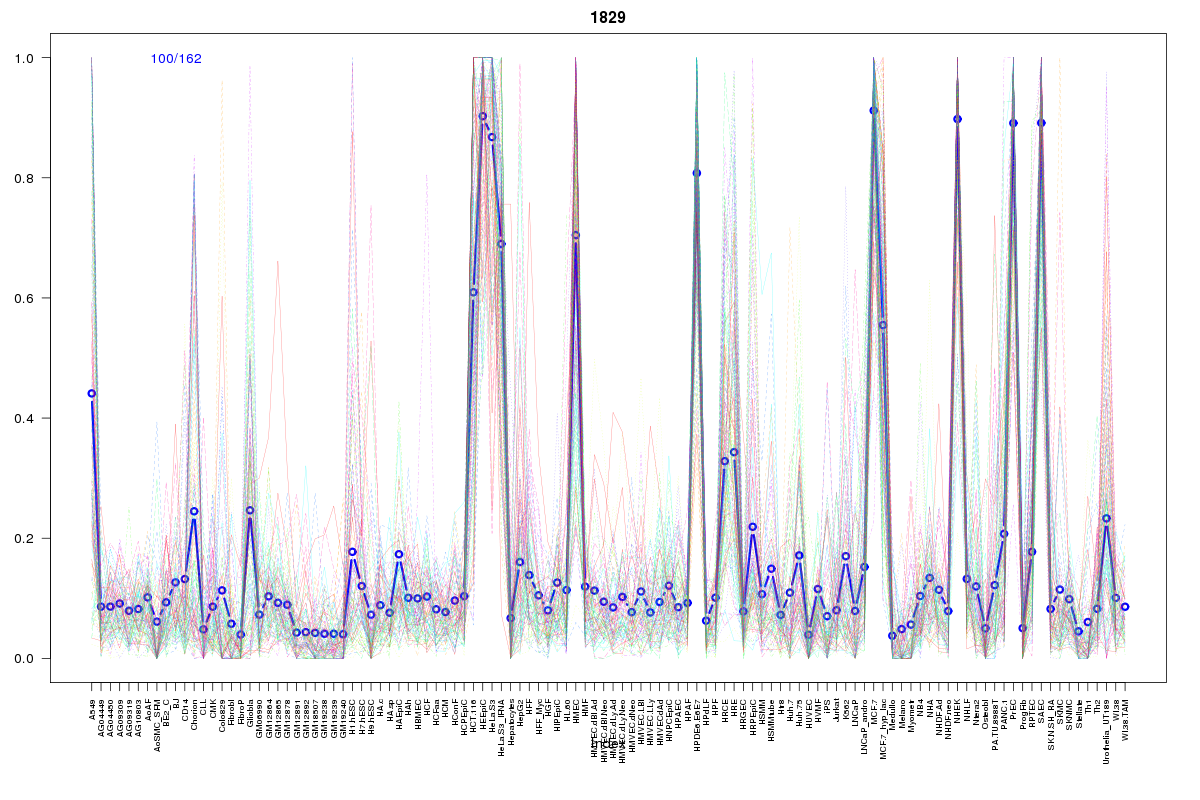
Cluster Hypersensitivity Profile

Genomic Location Trend
These plots show the distribution of the DHS sites surrounding the Transcript Start Site of the nearest gene.
Stats
Number of sites: 162Promoter: 8%
CpG-Island: 0%
Conserved: 44%
Enriched Motifs & Matches
Match Detail: [Jaspar]
|
| ||
|---|---|---|
| Sites: 47/100 | e-val: 4.8e-21 | ||
| Factor | e-val(match) | DB |
| Klf4 | 0.00000000012545 | JASPAR |
| T | 0.00028258 | JASPAR |
| RREB1 | 0.010729 | JASPAR |
| Egr1 | 0.013556 | JASPAR |
| Hand1::Tcfe2a | 0.017287 | JASPAR |
|
| ||
| Sites: 41/100 | e-val: 8.8e-16 | ||
| Factor | e-val(match) | DB |
| AP1 | 0.00000000037352 | JASPAR |
| NFE2L2 | 0.0000013507 | JASPAR |
| PPARG | 0.008648 | JASPAR |
| NFE2L1::MafG | 0.016098 | JASPAR |
| PBX1 | 0.027249 | JASPAR |
|
| ||
| Sites: 19/100 | e-val: 0.00036 | ||
| Factor | e-val(match) | DB |
| SP1 | 0.00098267 | JASPAR |
| Klf4 | 0.0028035 | JASPAR |
| EWSR1-FLI1 | 0.0043609 | JASPAR |
| Pax4 | 0.016852 | JASPAR |
| INSM1 | 0.017945 | JASPAR |
BED file downloads
Top 10 Example Regions
| Location | Gene Link | Dist. |
|---|---|---|
| chr10: 102878520-102878670 | RP11-31L23.3 | 28.87 |
| chr12: 92171480-92171630 | RP11-587P21.2 | 37.15 |
| chr8: 124194565-124194715 | ZHX1 | 42.91 |
| chr19: 35659280-35659430 | FXYD3 | 59.35 |
| chr19: 35659280-35659430 | LSR | 59.35 |
| chr16: 68692460-68692610 | CDH1 | 60.19 |
| chr16: 68692460-68692610 | CDH3 | 60.19 |
| chr8: 124323060-124323210 | IMPDH1P6 | 68.97 |
| chr16: 4995740-4995890 | PPL | 70.13 |
| chr17: 73719480-73719630 | ITGB4 | 70.6 |