SOM cluster: 1814
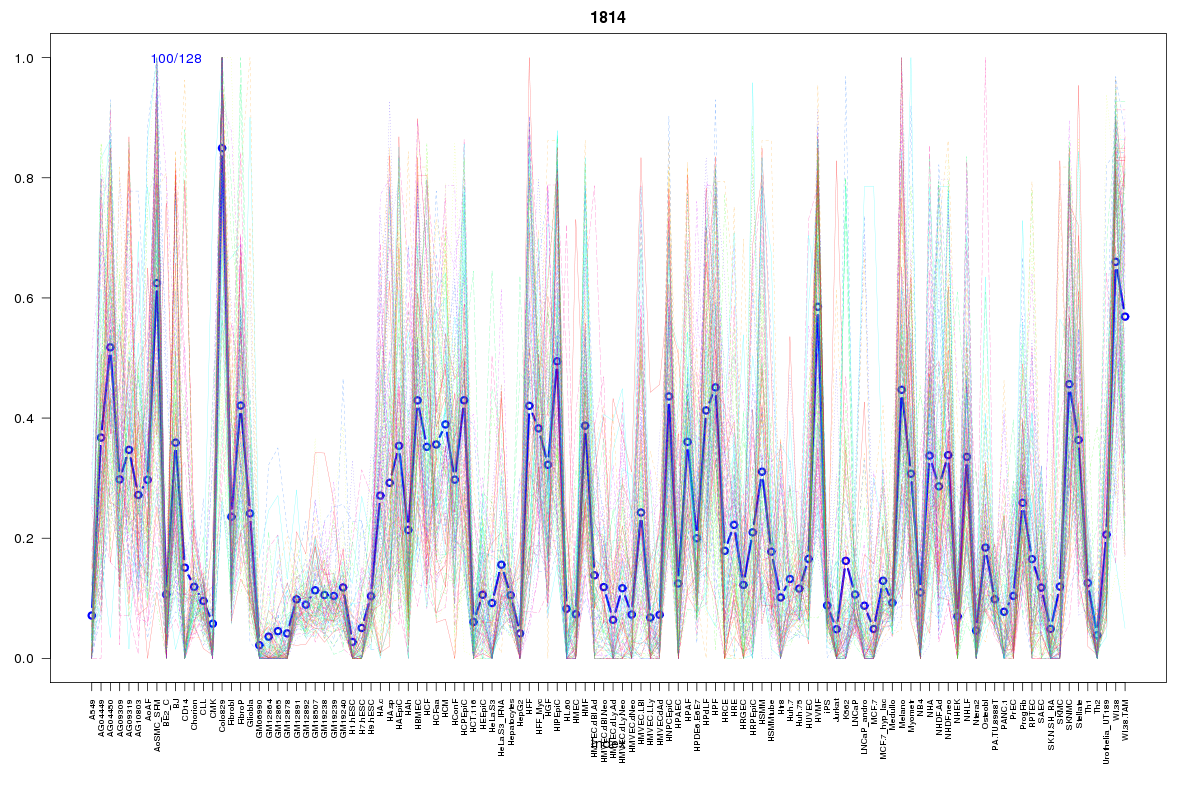
Cluster Hypersensitivity Profile

Genomic Location Trend
These plots show the distribution of the DHS sites surrounding the Transcript Start Site of the nearest gene.
Stats
Number of sites: 128Promoter: 2%
CpG-Island: 0%
Conserved: 56%
Enriched Motifs & Matches
Match Detail: [Jaspar]
|
| ||
|---|---|---|
| Sites: 25/100 | e-val: 0.000059 | ||
| Factor | e-val(match) | DB |
| AP1 | 0.00000000065611 | JASPAR |
| NFE2L2 | 0.00000000087282 | JASPAR |
| NFE2L1::MafG | 0.0002256 | JASPAR |
| Pax2 | 0.0039363 | JASPAR |
| PBX1 | 0.0063417 | JASPAR |
|
| ||
| Sites: 26/100 | e-val: 0.026 | ||
| Factor | e-val(match) | DB |
| FOXO3 | 0.00012167 | JASPAR |
| Foxd3 | 0.001065 | JASPAR |
| Foxq1 | 0.0025261 | JASPAR |
| ARID3A | 0.0032696 | JASPAR |
| Foxa2 | 0.0065522 | JASPAR |
BED file downloads
Top 10 Example Regions
| Location | Gene Link | Dist. |
|---|---|---|
| chr10: 25247665-25247815 | PRTFDC1 | 47.78 |
| chr2: 69405220-69405370 | ANTXR1 | 49.27 |
| chr3: 45245700-45245850 | TMEM158 | 50.53 |
| chr3: 45245700-45245850 | AC010170.1 | 50.53 |
| chr3: 113006040-113006190 | BOC | 52.1 |
| chr8: 116470260-116470410 | TRPS1 | 54.41 |
| chr11: 131630360-131630510 | NTM | 57.98 |
| chr1: 52372120-52372270 | RAB3B | 58.66 |
| chr4: 154369640-154369790 | RN7SL419P | 60.79 |
| chr11: 111717620-111717770 | FDXACB1 | 64.19 |