SOM cluster: 1808
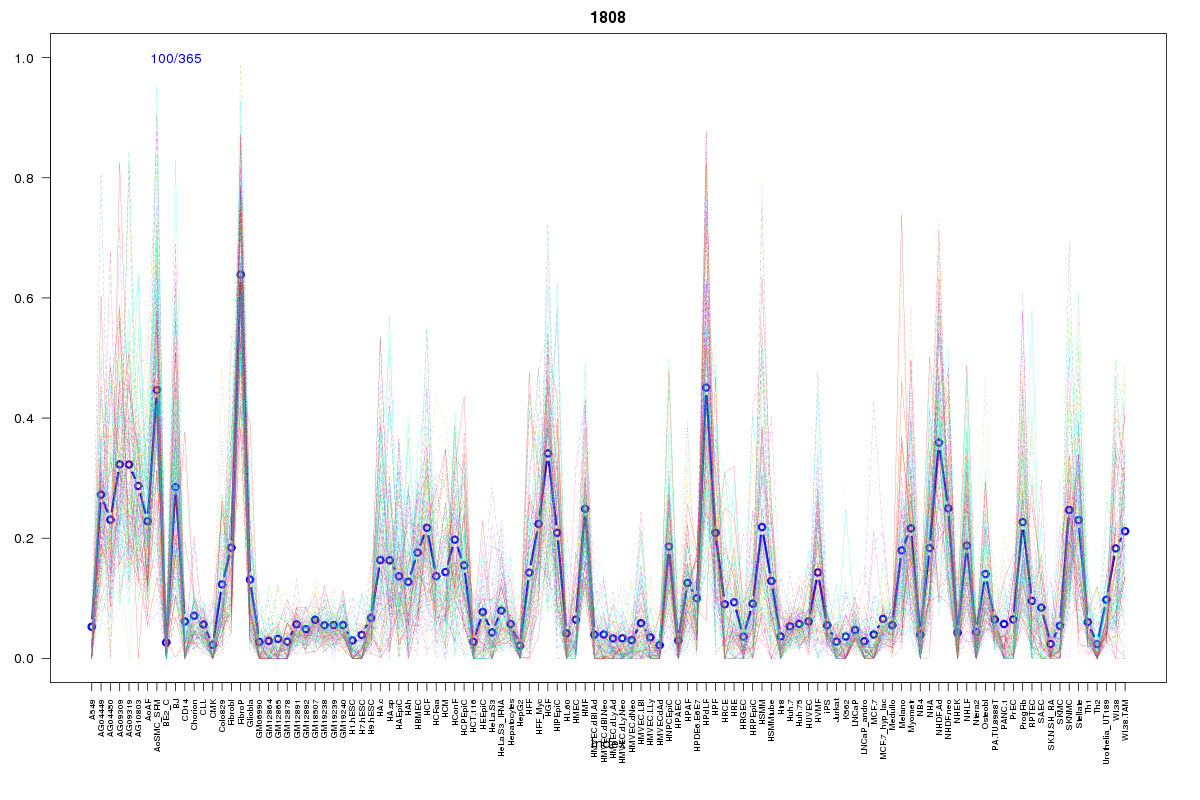
Cluster Hypersensitivity Profile

Genomic Location Trend
These plots show the distribution of the DHS sites surrounding the Transcript Start Site of the nearest gene.
Stats
Number of sites: 365Promoter: 0%
CpG-Island: 0%
Conserved: 38%
Enriched Motifs & Matches
Match Detail: [Jaspar]
|
| ||
|---|---|---|
| Sites: 58/100 | e-val: 3.6e-16 | ||
| Factor | e-val(match) | DB |
| AP1 | 0.00000000059833 | JASPAR |
| NFE2L2 | 0.0000000044049 | JASPAR |
| NFE2L1::MafG | 0.00017264 | JASPAR |
| PBX1 | 0.011181 | JASPAR |
| Pax2 | 0.019299 | JASPAR |
|
| ||
| Sites: 32/100 | e-val: 0.0000000000016 | ||
| Factor | e-val(match) | DB |
| Foxq1 | 0.0000023625 | JASPAR |
| Foxd3 | 0.0000041891 | JASPAR |
| FOXI1 | 0.0013135 | JASPAR |
| Evi1 | 0.0030096 | JASPAR |
| Lhx3 | 0.0030285 | JASPAR |
BED file downloads
Top 10 Example Regions
| Location | Gene Link | Dist. |
|---|---|---|
| chr1: 92216100-92216250 | TGFBR3 | 7.76 |
| chr3: 141679660-141679810 | ATP1B3 | 40.4 |
| chr3: 61894140-61894290 | PTPRG | 41.9 |
| chrX: 128967760-128967910 | XPNPEP2 | 46.54 |
| chrX: 128967760-128967910 | SASH3 | 46.54 |
| chr3: 157185160-157185310 | VEPH1 | 51.83 |
| chr3: 157185160-157185310 | PTX3 | 51.83 |
| chr3: 157185160-157185310 | C3orf55 | 51.83 |
| chr22: 41878760-41878910 | TEF | 55.57 |
| chr22: 41878760-41878910 | PHF5A | 55.57 |