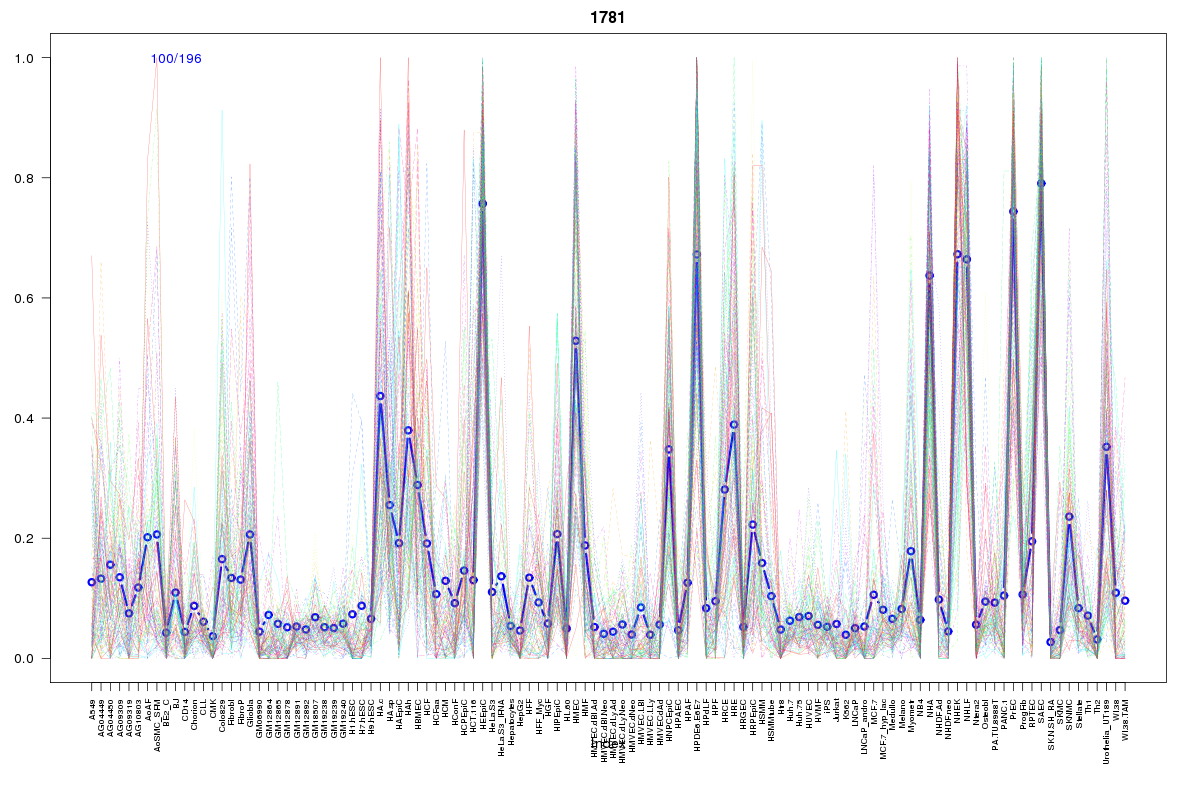
SOM cluster: 1781
Cluster Hypersensitivity Profile

Genomic Location Trend
These plots show the distribution of the DHS sites surrounding the Transcript Start Site of the nearest gene.
Stats
Number of sites: 196Promoter: 2%
CpG-Island: 0%
Conserved: 29%
Enriched Motifs & Matches
Match Detail: [Jaspar]
|
| ||
|---|---|---|
| Sites: 40/100 | e-val: 0.54 | ||
| Factor | e-val(match) | DB |
| NFE2L2 | 0.000000000034975 | JASPAR |
| AP1 | 0.00000000071512 | JASPAR |
| NFE2L1::MafG | 0.000093362 | JASPAR |
| Pax2 | 0.0027168 | JASPAR |
| PBX1 | 0.0043497 | JASPAR |
BED file downloads
Top 10 Example Regions
| Location | Gene Link | Dist. |
|---|---|---|
| chrX: 9881200-9881350 | SHROOM2 | 42.4 |
| chr7: 42210420-42210570 | GLI3 | 57.22 |
| chr17: 70583420-70583570 | LINC00511 | 59.35 |
| chr1: 203605560-203605710 | ATP2B4 | 63.34 |
| chr5: 114797860-114798010 | FEM1C | 67.45 |
| chr5: 114797860-114798010 | CTNNAP1 | 67.45 |
| chr12: 1306540-1306690 | ERC1 | 72.05 |
| chr12: 8831260-8831410 | RIMKLB | 76.81 |
| chr12: 8831260-8831410 | MFAP5 | 76.81 |
| chr1: 95089300-95089450 | RP11-86H7.7 | 77.91 |