SOM cluster: 1774
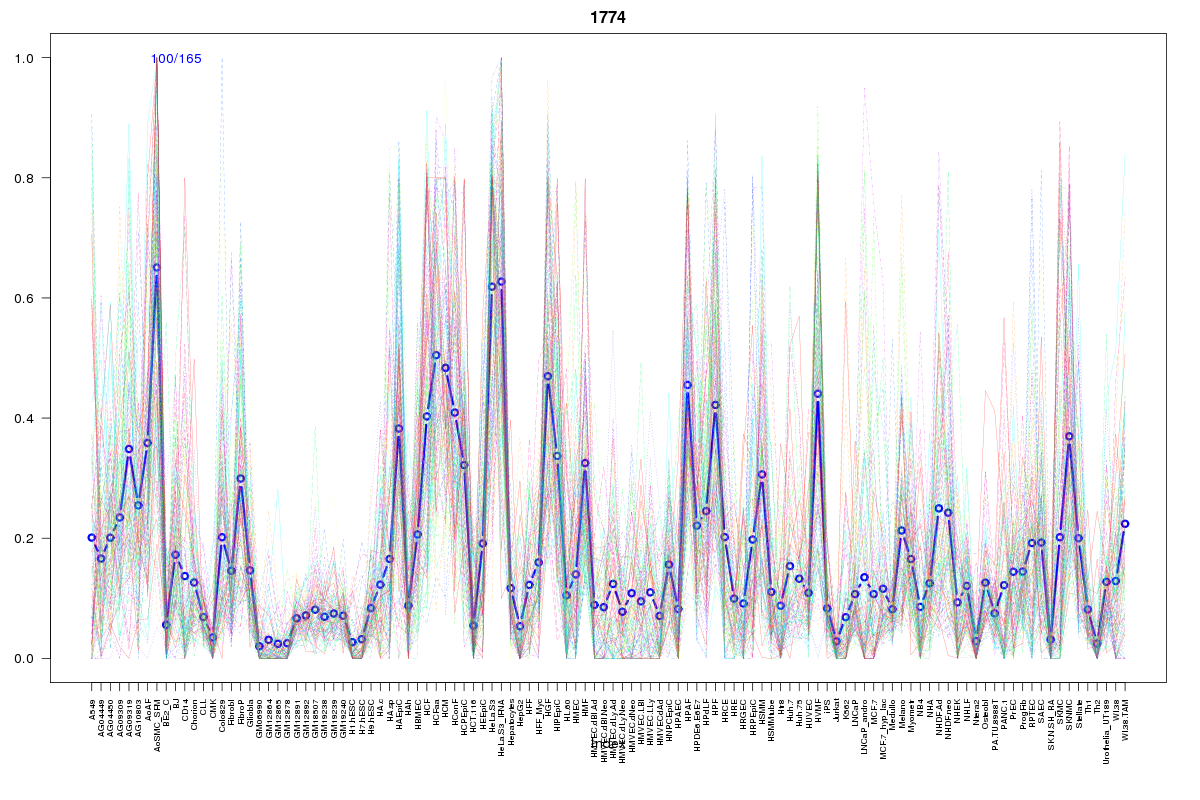
Cluster Hypersensitivity Profile

Genomic Location Trend
These plots show the distribution of the DHS sites surrounding the Transcript Start Site of the nearest gene.
Stats
Number of sites: 165Promoter: 4%
CpG-Island: 1%
Conserved: 33%
Enriched Motifs & Matches
Match Detail: [Jaspar]
|
| ||
|---|---|---|
| Sites: 29/100 | e-val: 0.00092 | ||
| Factor | e-val(match) | DB |
| CEBPA | 0.0000000060951 | JASPAR |
| HLF | 0.000025719 | JASPAR |
| NFIL3 | 0.00052761 | JASPAR |
| Pou5f1 | 0.0013048 | JASPAR |
| Sox2 | 0.0017387 | JASPAR |
BED file downloads
Top 10 Example Regions
| Location | Gene Link | Dist. |
|---|---|---|
| chr9: 133406460-133406610 | snoU13 | 39.34 |
| chr19: 11300320-11300470 | SPC24 | 47.59 |
| chr19: 11300320-11300470 | KANK2 | 47.59 |
| chr12: 29866040-29866190 | TMTC1 | 60.71 |
| chr3: 158450545-158450695 | GFM1 | 62.53 |
| chr3: 158450545-158450695 | RARRES1 | 62.53 |
| chr1: 196515880-196516030 | KCNT2 | 66.24 |
| chr2: 74466080-74466230 | SLC4A5 | 71.4 |
| chr17: 7685680-7685830 | KDM6B | 74.46 |
| chr14: 76026445-76026595 | JDP2 | 77 |