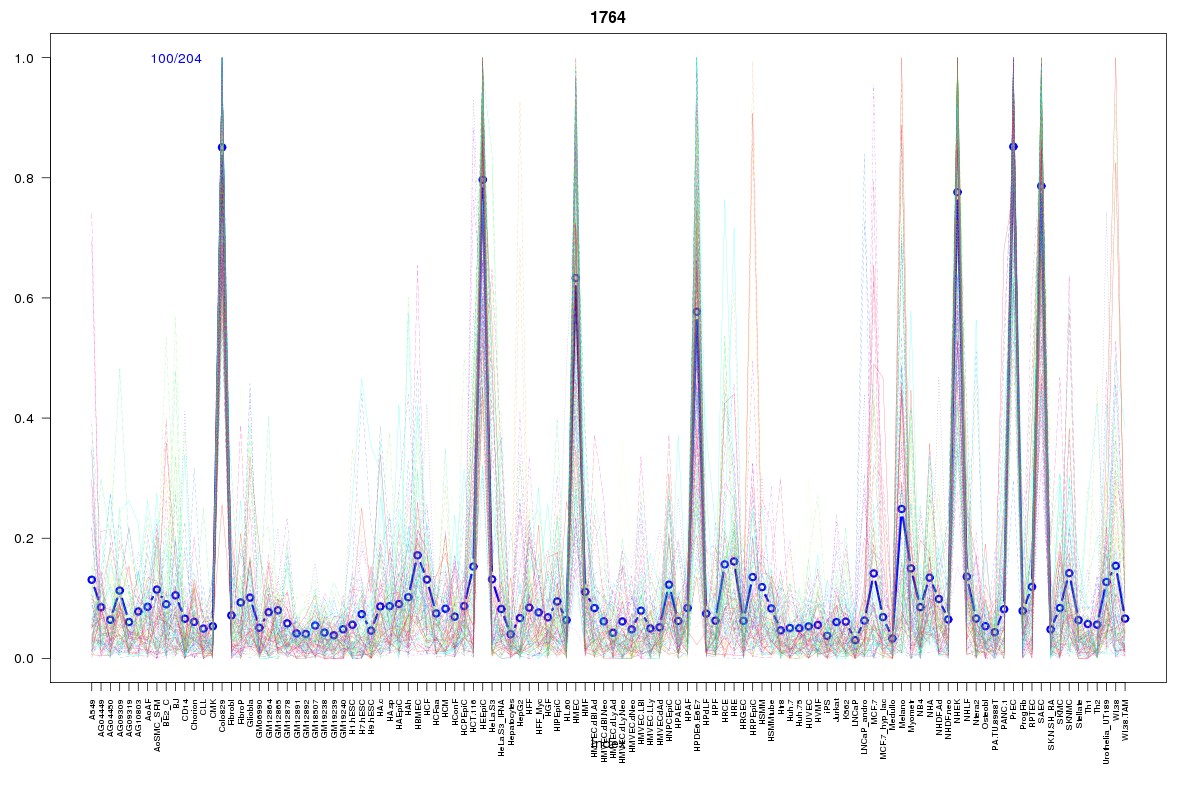
SOM cluster: 1764
Cluster Hypersensitivity Profile

Genomic Location Trend
These plots show the distribution of the DHS sites surrounding the Transcript Start Site of the nearest gene.
Stats
Number of sites: 204Promoter: 2%
CpG-Island: 0%
Conserved: 43%
Enriched Motifs & Matches
Match Detail: [Jaspar]
|
| ||
|---|---|---|
| Sites: 40/100 | e-val: 0.000000000099 | ||
| Factor | e-val(match) | DB |
| AP1 | 0.00000000021919 | JASPAR |
| NFE2L2 | 0.000000014711 | JASPAR |
| NFE2L1::MafG | 0.00024094 | JASPAR |
| PBX1 | 0.0012409 | JASPAR |
| HNF1B | 0.04055 | JASPAR |
BED file downloads
Top 10 Example Regions
| Location | Gene Link | Dist. |
|---|---|---|
| chr4: 10347840-10347990 | ZNF518B | 52.41 |
| chr11: 130716680-130716830 | RP11-890B15.2 | 55.47 |
| chr18: 61554780-61554930 | SERPINB2 | 56.63 |
| chr18: 61554780-61554930 | HMSD | 56.63 |
| chr18: 61554780-61554930 | SERPINB7 | 56.63 |
| chr18: 61554780-61554930 | SERPINB8 | 56.63 |
| chr9: 33763900-33764050 | PRSS3 | 61.52 |
| chr6: 18047645-18047795 | KIF13A | 67.42 |
| chr6: 18047645-18047795 | TPMT | 67.42 |
| chr6: 18047645-18047795 | RP3-525L6.2 | 67.42 |