SOM cluster: 1761
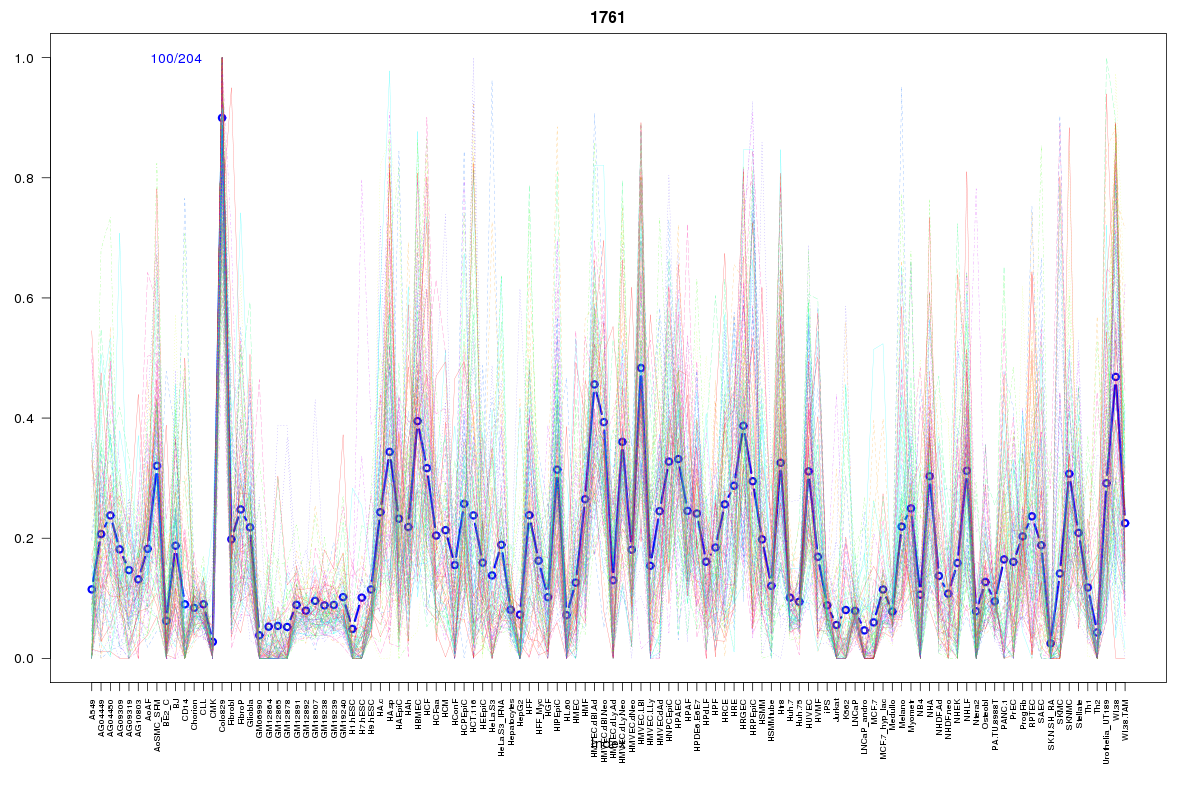
Cluster Hypersensitivity Profile

Genomic Location Trend
These plots show the distribution of the DHS sites surrounding the Transcript Start Site of the nearest gene.
Stats
Number of sites: 204Promoter: 3%
CpG-Island: 0%
Conserved: 47%
Enriched Motifs & Matches
Match Detail: [Jaspar]
|
| ||
|---|---|---|
| Sites: 47/100 | e-val: 1.2e-30 | ||
| Factor | e-val(match) | DB |
| AP1 | 0.00000000082076 | JASPAR |
| NFE2L2 | 0.0000000016505 | JASPAR |
| NFE2L1::MafG | 0.00010064 | JASPAR |
| PBX1 | 0.008851 | JASPAR |
| Pax2 | 0.0091658 | JASPAR |
|
| ||
| Sites: 47/100 | e-val: 0.0000000000036 | ||
| Factor | e-val(match) | DB |
| Foxd3 | 0.00021267 | JASPAR |
| ARID3A | 0.00078609 | JASPAR |
| FOXA1 | 0.00085013 | JASPAR |
| SPIB | 0.0039734 | JASPAR |
| Foxa2 | 0.0040452 | JASPAR |
BED file downloads
Top 10 Example Regions
| Location | Gene Link | Dist. |
|---|---|---|
| chr7: 112124660-112124810 | IFRD1 | 43.35 |
| chr7: 112124660-112124810 | NPM1P14 | 43.35 |
| chr1: 171708900-171709050 | VAMP4 | 43.8 |
| chrX: 9879680-9879830 | AC002365.1 | 47.07 |
| chrX: 9879680-9879830 | SHROOM2 | 47.07 |
| chr8: 124115900-124116050 | RP11-557C18.3 | 49.86 |
| chr12: 24770520-24770670 | RP11-444D3.1 | 52.14 |
| chr2: 109210340-109210490 | LIMS1 | 54.47 |
| chr2: 109210340-109210490 | AC010095.5 | 54.47 |
| chr3: 190284060-190284210 | GCNT1P3 | 60.44 |