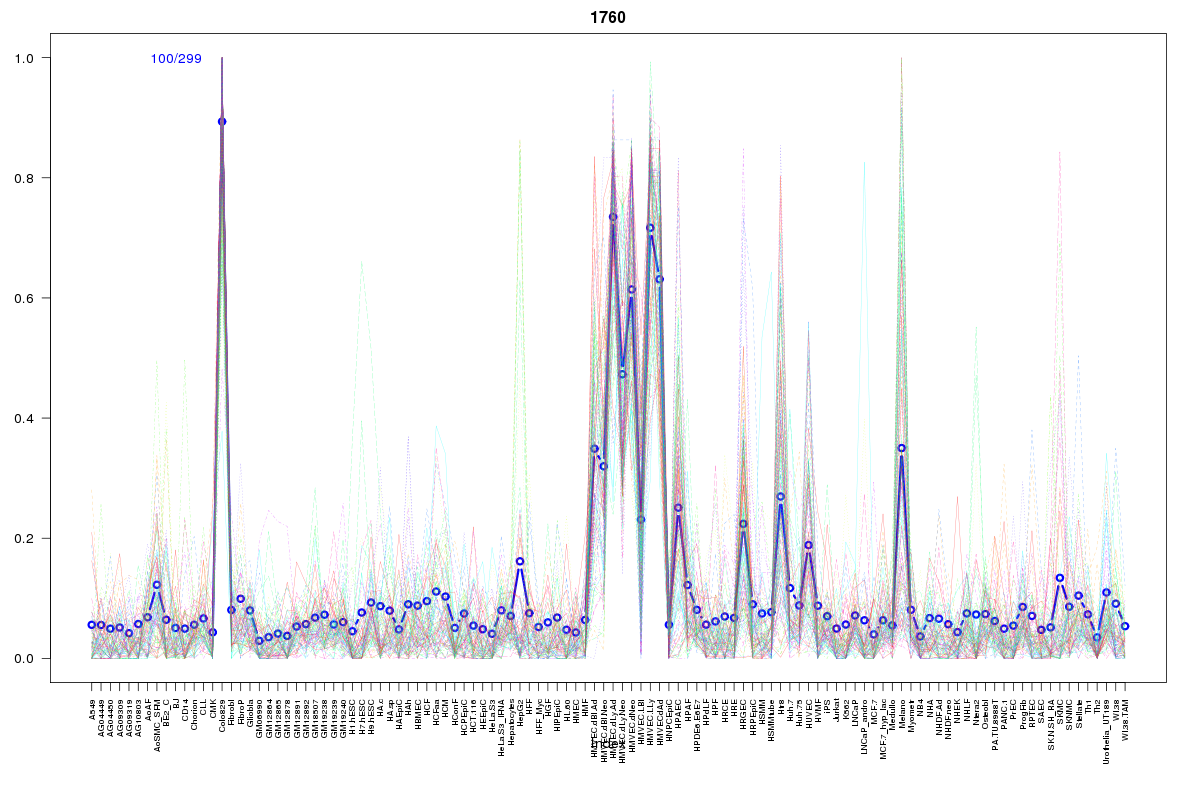
SOM cluster: 1760
Cluster Hypersensitivity Profile

Genomic Location Trend
These plots show the distribution of the DHS sites surrounding the Transcript Start Site of the nearest gene.
Stats
Number of sites: 299Promoter: 1%
CpG-Island: 0%
Conserved: 52%
Enriched Motifs & Matches
Match Detail: [Jaspar]
|
| ||
|---|---|---|
| Sites: 38/100 | e-val: 2.4e-20 | ||
| Factor | e-val(match) | DB |
| FEV | 0.00026486 | JASPAR |
| NFATC2 | 0.001947 | JASPAR |
| Foxd3 | 0.002679 | JASPAR |
| EWSR1-FLI1 | 0.007002 | JASPAR |
| SPIB | 0.0085805 | JASPAR |
|
| ||
| Sites: 50/100 | e-val: 0.000000057 | ||
| Factor | e-val(match) | DB |
| FEV | 0.00000041094 | JASPAR |
| SPI1 | 0.000059322 | JASPAR |
| Stat3 | 0.000072909 | JASPAR |
| SPIB | 0.000076533 | JASPAR |
| ELK4 | 0.0001589 | JASPAR |
BED file downloads
Top 10 Example Regions
| Location | Gene Link | Dist. |
|---|---|---|
| chr2: 47313280-47313430 | TTC7A | 40.35 |
| chr1: 168197960-168198110 | TBX19 | 46.34 |
| chr1: 168197960-168198110 | ANKRD36BP1 | 46.34 |
| chr12: 89674720-89674870 | DUSP6 | 55.35 |
| chr6: 11203120-11203270 | NEDD9 | 57.32 |
| chr6: 20192920-20193070 | MBOAT1 | 57.98 |
| chr4: 90418780-90418930 | RP11-115D19.1 | 62.63 |
| chr6: 37337740-37337890 | TBC1D22B | 65.18 |
| chr3: 149327725-149327875 | WWTR1 | 70.37 |
| chr3: 149327725-149327875 | WWTR1-AS1 | 70.37 |