SOM cluster: 1759
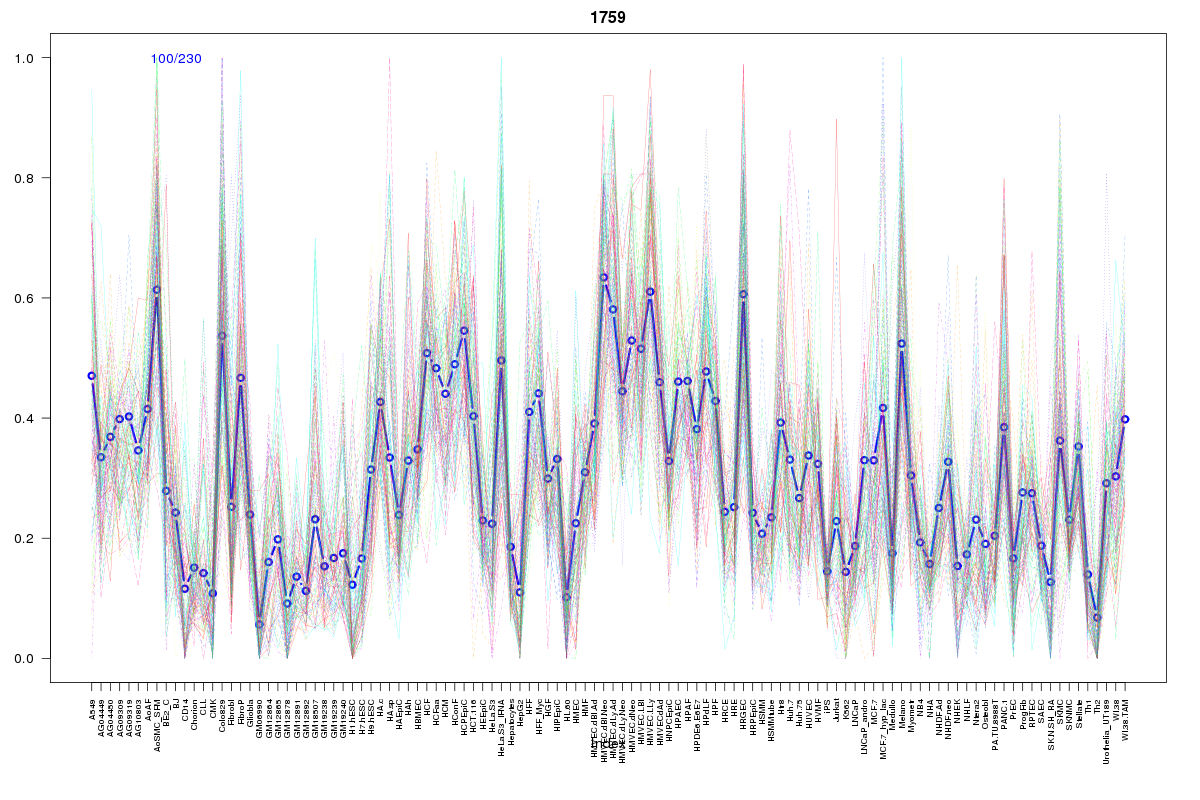
Cluster Hypersensitivity Profile

Genomic Location Trend
These plots show the distribution of the DHS sites surrounding the Transcript Start Site of the nearest gene.
Stats
Number of sites: 230Promoter: 2%
CpG-Island: 0%
Conserved: 78%
Enriched Motifs & Matches
Match Detail: [Jaspar]
|
| ||
|---|---|---|
| Sites: 89/100 | e-val: 0 | ||
| Factor | e-val(match) | DB |
| CTCF | 0.000000000000024425 | JASPAR |
| INSM1 | 0.0061541 | JASPAR |
| TAL1::TCF3 | 0.0097814 | JASPAR |
| Zfp423 | 0.011039 | JASPAR |
| T | 0.013656 | JASPAR |
|
| ||
| Sites: 83/100 | e-val: 1.9e-28 | ||
| Factor | e-val(match) | DB |
| Lhx3 | 0.00002924 | JASPAR |
| ARID3A | 0.00081574 | JASPAR |
| NFATC2 | 0.00099659 | JASPAR |
| Foxd3 | 0.0024925 | JASPAR |
| Nkx2-5 | 0.0064955 | JASPAR |
|
| ||
| Sites: 31/100 | e-val: 0.00039 | ||
| Factor | e-val(match) | DB |
| Pax4 | 0.00026109 | JASPAR |
| Foxd3 | 0.00031637 | JASPAR |
| FOXA1 | 0.0014135 | JASPAR |
| IRF1 | 0.0034743 | JASPAR |
| Pou5f1 | 0.013598 | JASPAR |
BED file downloads
Top 10 Example Regions
| Location | Gene Link | Dist. |
|---|---|---|
| chr10: 29666445-29666595 | PTCHD3P1 | 44.89 |
| chr12: 27577740-27577890 | PPFIBP1 | 50.53 |
| chr5: 146771580-146771730 | DPYSL3 | 54.12 |
| chr8: 80964840-80964990 | MRPS28 | 56.44 |
| chr19: 46785760-46785910 | HIF3A | 67.1 |
| chr1: 94987980-94988130 | RP11-86H7.7 | 68.2 |
| chr12: 75954080-75954230 | RP11-585P4.5 | 69.23 |
| chr12: 13177220-13177370 | HEBP1 | 69.38 |
| chr15: 63074560-63074710 | RP11-1069G10.1 | 70.41 |
| chr3: 45541140-45541290 | LIMD1 | 70.75 |