SOM cluster: 175
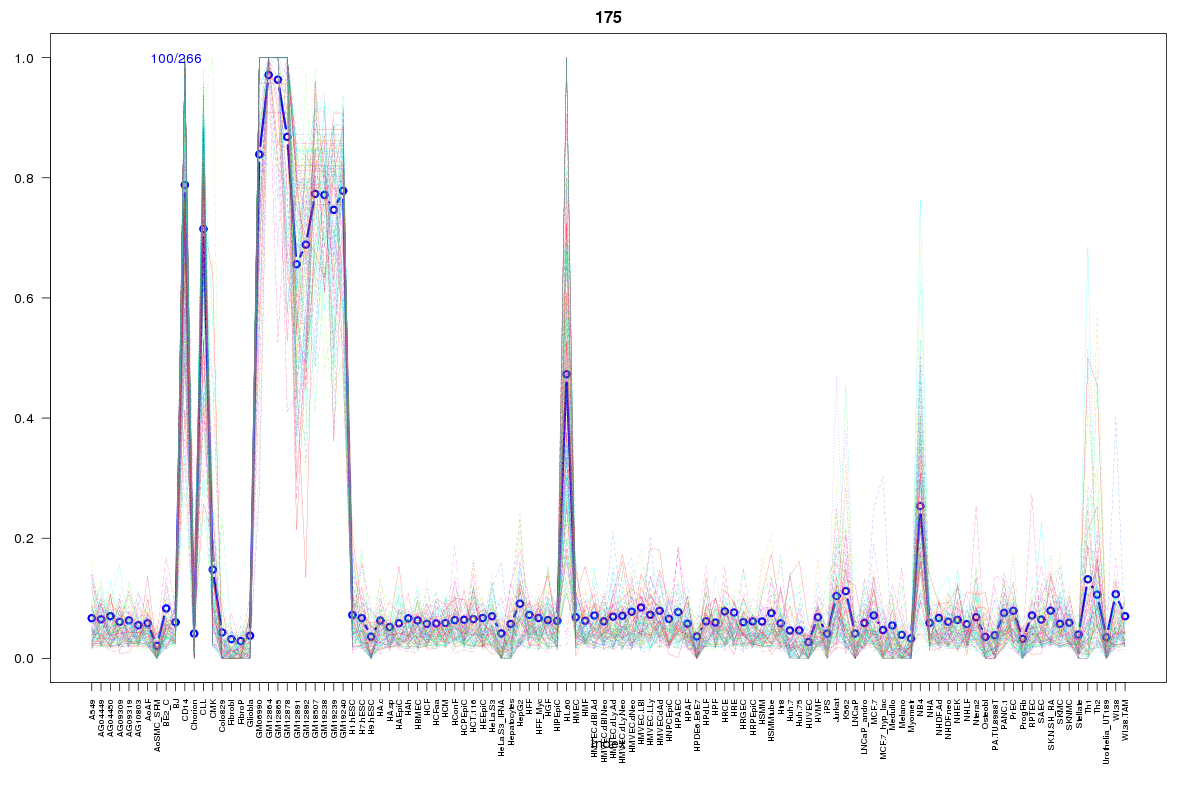
Cluster Hypersensitivity Profile

Genomic Location Trend
These plots show the distribution of the DHS sites surrounding the Transcript Start Site of the nearest gene.
Stats
Number of sites: 266Promoter: 4%
CpG-Island: 0%
Conserved: 27%
Enriched Motifs & Matches
Match Detail: [Jaspar]
|
| ||
|---|---|---|
| Sites: 50/100 | e-val: 0 | ||
| Factor | e-val(match) | DB |
| SPI1 | 0.00000051916 | JASPAR |
| SPIB | 0.0000054522 | JASPAR |
| IRF1 | 0.0000095673 | JASPAR |
| IRF2 | 0.00042999 | JASPAR |
| FEV | 0.00073578 | JASPAR |
BED file downloads
Top 10 Example Regions
| Location | Gene Link | Dist. |
|---|---|---|
| chr5: 150635540-150635690 | SLC36A2 | 44.01 |
| chr5: 150635540-150635690 | GM2A | 44.01 |
| chr9: 132663120-132663270 | TOR1B | 52.69 |
| chr9: 132663120-132663270 | FNBP1 | 52.69 |
| chr12: 11989625-11989775 | ETV6 | 54.21 |
| chr1: 207587980-207588130 | CR1 | 54.53 |
| chr1: 207587980-207588130 | CR2 | 54.53 |
| chr20: 44740060-44740210 | CDH22 | 55.99 |
| chr20: 44740060-44740210 | SLC12A5 | 55.99 |
| chr12: 105035760-105035910 | CHST11 | 56.58 |