SOM cluster: 1744
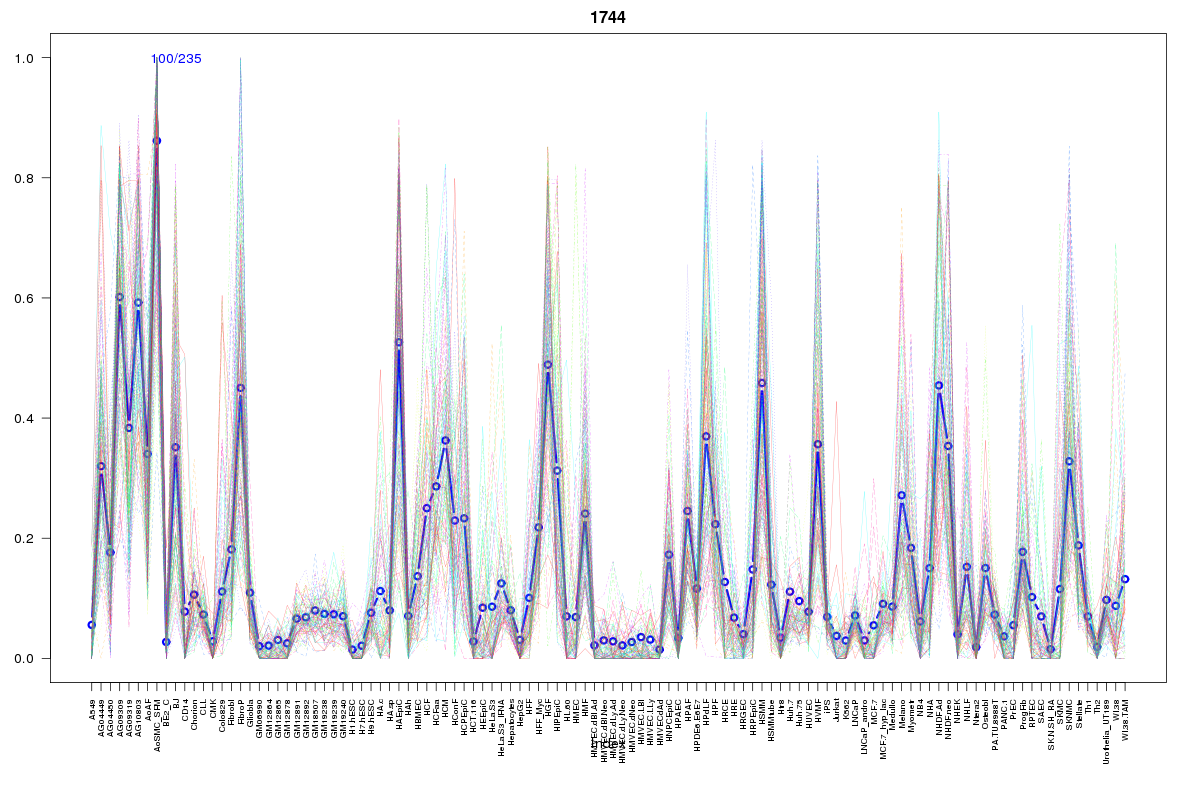
Cluster Hypersensitivity Profile

Genomic Location Trend
These plots show the distribution of the DHS sites surrounding the Transcript Start Site of the nearest gene.
Stats
Number of sites: 235Promoter: 0%
CpG-Island: 0%
Conserved: 32%
Enriched Motifs & Matches
Match Detail: [Jaspar]
|
| ||
|---|---|---|
| Sites: 58/100 | e-val: 4.3e-20 | ||
| Factor | e-val(match) | DB |
| CEBPA | 0.0000027734 | JASPAR |
| NFIL3 | 0.012125 | JASPAR |
| Ddit3::Cebpa | 0.019444 | JASPAR |
| HLF | 0.021621 | JASPAR |
| Pou5f1 | 0.021989 | JASPAR |
|
| ||
| Sites: 25/100 | e-val: 0.0014 | ||
| Factor | e-val(match) | DB |
| HNF1A | 0.0001829 | JASPAR |
| NKX3-1 | 0.0016712 | JASPAR |
| HNF1B | 0.0052402 | JASPAR |
| NFATC2 | 0.005869 | JASPAR |
| FOXO3 | 0.023728 | JASPAR |
BED file downloads
Top 10 Example Regions
| Location | Gene Link | Dist. |
|---|---|---|
| chr12: 7314500-7314650 | C1R | 44.83 |
| chr12: 7314500-7314650 | C1RL-AS1 | 44.83 |
| chr12: 7314500-7314650 | C1RL | 44.83 |
| chr2: 39696240-39696390 | AC007246.3 | 45.1 |
| chr5: 143519320-143519470 | YIPF5 | 50.89 |
| chr5: 143519320-143519470 | KCTD16 | 50.89 |
| chr5: 143519320-143519470 | RN7SL87P | 50.89 |
| chr12: 91619200-91619350 | DCN | 54.53 |
| chr7: 39920260-39920410 | CDK13 | 55.28 |
| chr7: 39920260-39920410 | AC004987.9 | 55.28 |