SOM cluster: 1742
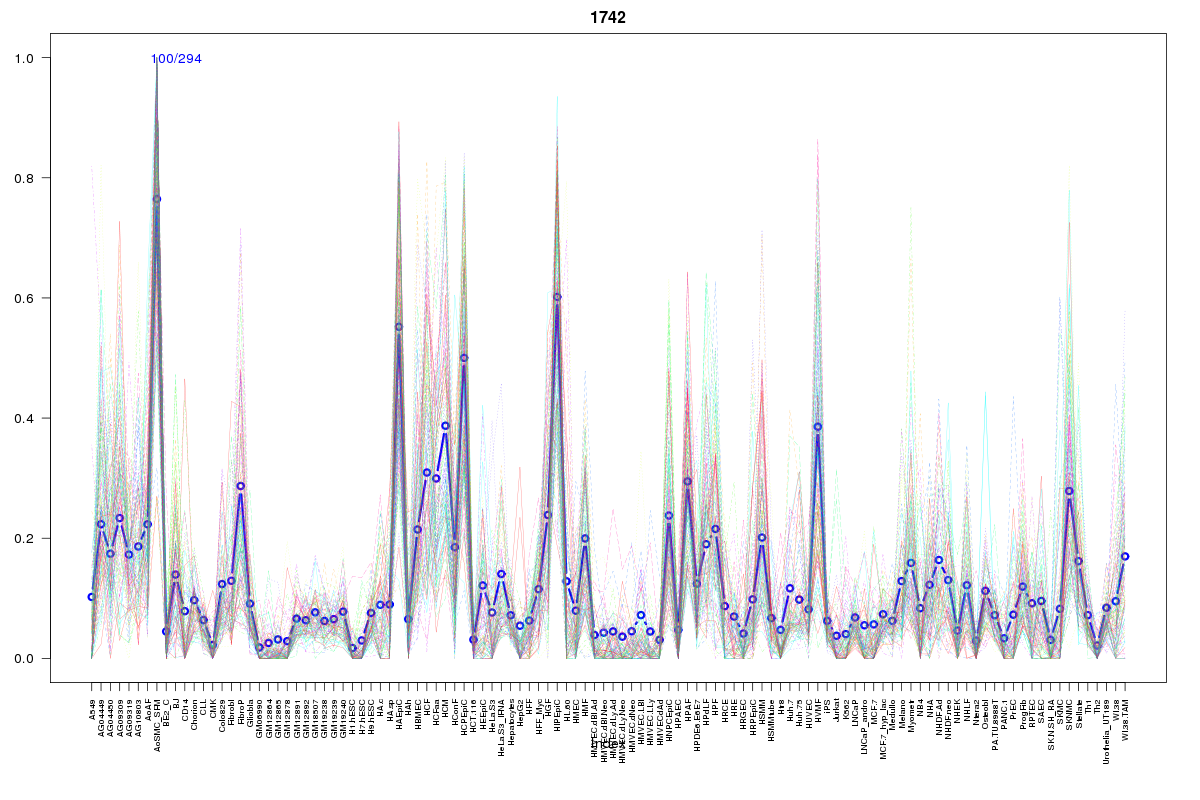
Cluster Hypersensitivity Profile

Genomic Location Trend
These plots show the distribution of the DHS sites surrounding the Transcript Start Site of the nearest gene.
Stats
Number of sites: 294Promoter: 1%
CpG-Island: 0%
Conserved: 19%
Enriched Motifs & Matches
Match Detail: [Jaspar]
|
| ||
|---|---|---|
| Sites: 37/100 | e-val: 0.000000002 | ||
| Factor | e-val(match) | DB |
| CEBPA | 0.0000017142 | JASPAR |
| HLF | 0.0000030575 | JASPAR |
| NFIL3 | 0.0000072744 | JASPAR |
| NFE2L2 | 0.00083145 | JASPAR |
| Pou5f1 | 0.001296 | JASPAR |
BED file downloads
Top 10 Example Regions
| Location | Gene Link | Dist. |
|---|---|---|
| chr11: 36034640-36034790 | LDLRAD3 | 38.87 |
| chr9: 129828820-129828970 | RALGPS1 | 56.78 |
| chr8: 71397120-71397270 | TRAM1 | 59.42 |
| chr8: 71397120-71397270 | AC120194.1 | 59.42 |
| chr4: 1694980-1695130 | SLBP | 62.22 |
| chr5: 58483720-58483870 | PDE4D | 67.5 |
| chr18: 19769500-19769650 | GATA6 | 72.46 |
| chr12: 91583280-91583430 | LUM | 76.15 |
| chr12: 91583280-91583430 | DCN | 76.15 |
| chr5: 158658240-158658390 | SNORA68 | 83.56 |