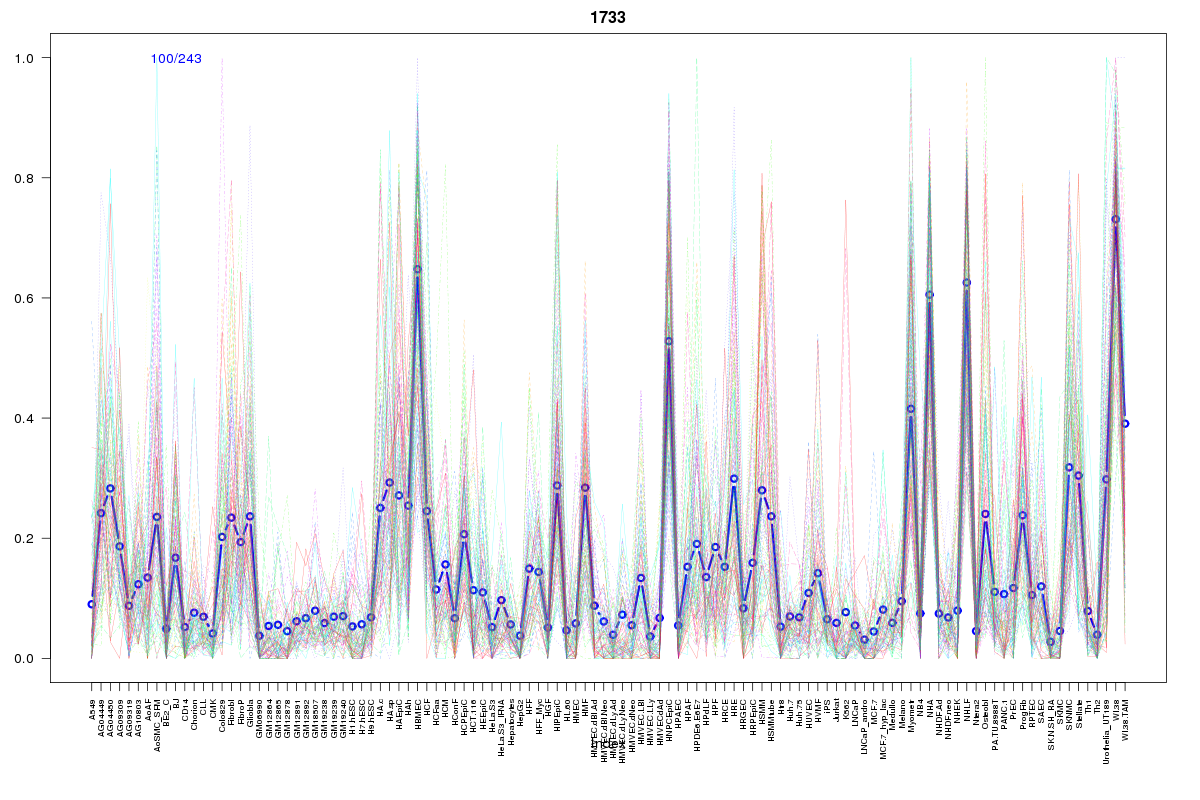
SOM cluster: 1733
Cluster Hypersensitivity Profile

Genomic Location Trend
These plots show the distribution of the DHS sites surrounding the Transcript Start Site of the nearest gene.
Stats
Number of sites: 243Promoter: 1%
CpG-Island: 0%
Conserved: 25%
Enriched Motifs & Matches
Match Detail: [Jaspar]
|
| ||
|---|---|---|
| Sites: 46/100 | e-val: 0.0000000000000017 | ||
| Factor | e-val(match) | DB |
| AP1 | 0.00000000013006 | JASPAR |
| NFE2L2 | 0.000000004162 | JASPAR |
| NFE2L1::MafG | 0.0043875 | JASPAR |
| PPARG | 0.0050575 | JASPAR |
| Pax2 | 0.02163 | JASPAR |
BED file downloads
Top 10 Example Regions
| Location | Gene Link | Dist. |
|---|---|---|
| chr1: 203538980-203539130 | ATP2B4 | 31.91 |
| chr11: 132555080-132555230 | OPCML | 45.1 |
| chr11: 28422000-28422150 | METTL15 | 58.86 |
| chr3: 189840340-189840490 | LEPREL1 | 60.89 |
| chr3: 189840340-189840490 | RNU6-1109P | 60.89 |
| chr10: 128991560-128991710 | FAM196A | 61.46 |
| chr1: 219616060-219616210 | RP11-95P13.1 | 63.55 |
| chr11: 2834860-2835010 | COX6CP18 | 64.87 |
| chr11: 2834860-2835010 | KCNQ1 | 64.87 |
| chr6: 130747320-130747470 | TMEM200A | 65.89 |