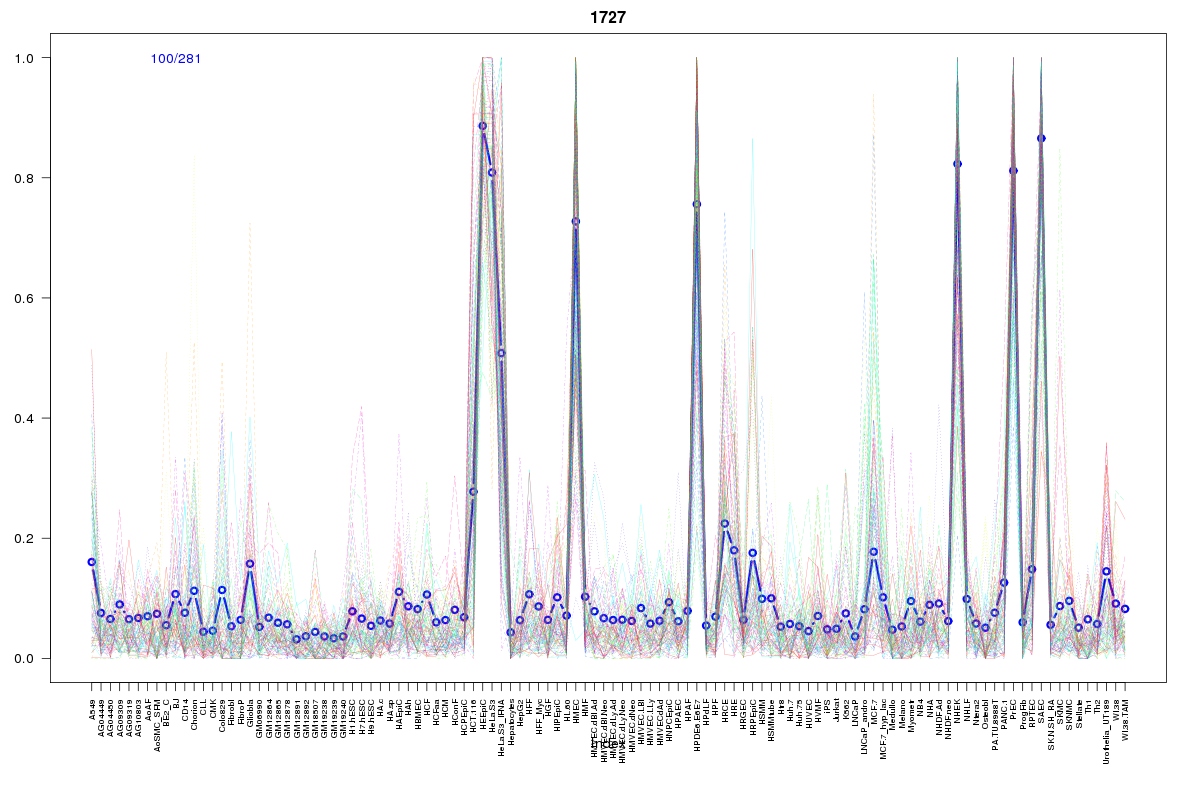
SOM cluster: 1727
Cluster Hypersensitivity Profile

Genomic Location Trend
These plots show the distribution of the DHS sites surrounding the Transcript Start Site of the nearest gene.
Stats
Number of sites: 281Promoter: 4%
CpG-Island: 0%
Conserved: 46%
Enriched Motifs & Matches
Match Detail: [Jaspar]
|
| ||
|---|---|---|
| Sites: 35/100 | e-val: 0.00000031 | ||
| Factor | e-val(match) | DB |
| AP1 | 0.000000000037093 | JASPAR |
| NFE2L2 | 0.0000000046236 | JASPAR |
| PPARG | 0.0043082 | JASPAR |
| NFE2L1::MafG | 0.0050017 | JASPAR |
| Foxa2 | 0.012686 | JASPAR |
BED file downloads
Top 10 Example Regions
| Location | Gene Link | Dist. |
|---|---|---|
| chr1: 209825820-209825970 | LAMB3 | 42.04 |
| chr1: 209825820-209825970 | RP1-272L16.1 | 42.04 |
| chr3: 45168420-45168570 | CDCP1 | 46.1 |
| chr5: 76055465-76055615 | F2RL1 | 47.54 |
| chr8: 59762920-59763070 | TOX | 55.71 |
| chr11: 66673580-66673730 | PC | 59.25 |
| chr11: 66673580-66673730 | C11orf80 | 59.25 |
| chr11: 66673580-66673730 | C11orf86 | 59.25 |
| chr2: 131565240-131565390 | ARHGEF4 | 59.28 |
| chr8: 10512120-10512270 | SOX7 | 61.22 |