SOM cluster: 1719
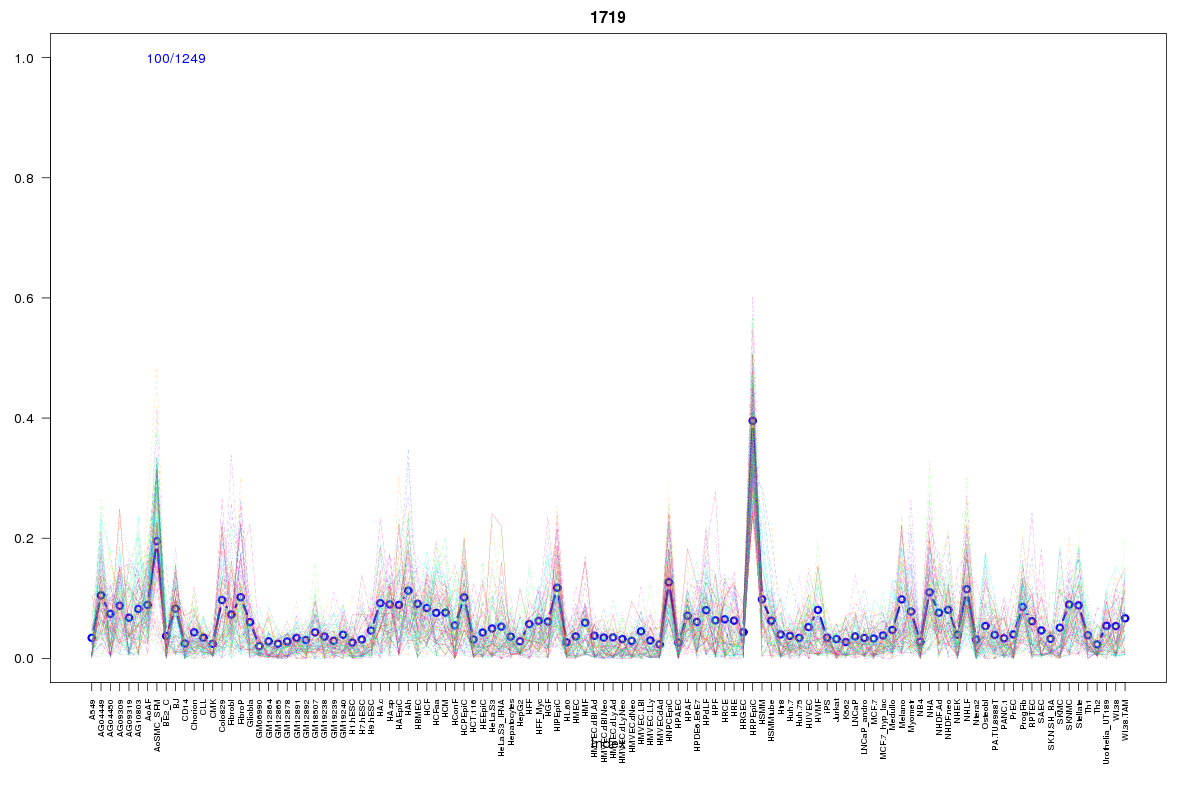
Cluster Hypersensitivity Profile

Genomic Location Trend
These plots show the distribution of the DHS sites surrounding the Transcript Start Site of the nearest gene.
Stats
Number of sites: 1249Promoter: 1%
CpG-Island: 0%
Conserved: 30%
Enriched Motifs & Matches
Match Detail: [Jaspar]
|
| ||
|---|---|---|
| Sites: 43/100 | e-val: 0.00000012 | ||
| Factor | e-val(match) | DB |
| TEAD1 | 0.0010609 | JASPAR |
| Lhx3 | 0.001154 | JASPAR |
| HNF1A | 0.011238 | JASPAR |
| Foxa2 | 0.011633 | JASPAR |
| FOXO3 | 0.013173 | JASPAR |
BED file downloads
Top 10 Example Regions
| Location | Gene Link | Dist. |
|---|---|---|
| chr1: 77566740-77566890 | ST6GALNAC5 | 49.01 |
| chr3: 38894640-38894790 | RP11-134J21.1 | 50.25 |
| chr8: 41127120-41127270 | CTD-3080F16.3 | 50.75 |
| chr8: 41127120-41127270 | SFRP1 | 50.75 |
| chr5: 143585720-143585870 | KCTD16 | 59.15 |
| chr4: 41402440-41402590 | LIMCH1 | 59.57 |
| chr3: 38209780-38209930 | OXSR1 | 60.41 |
| chr1: 55369940-55370090 | TMEM61 | 60.95 |
| chr8: 38806680-38806830 | HTRA4 | 61.3 |
| chr7: 106903420-106903570 | HBP1 | 61.76 |