SOM cluster: 1716
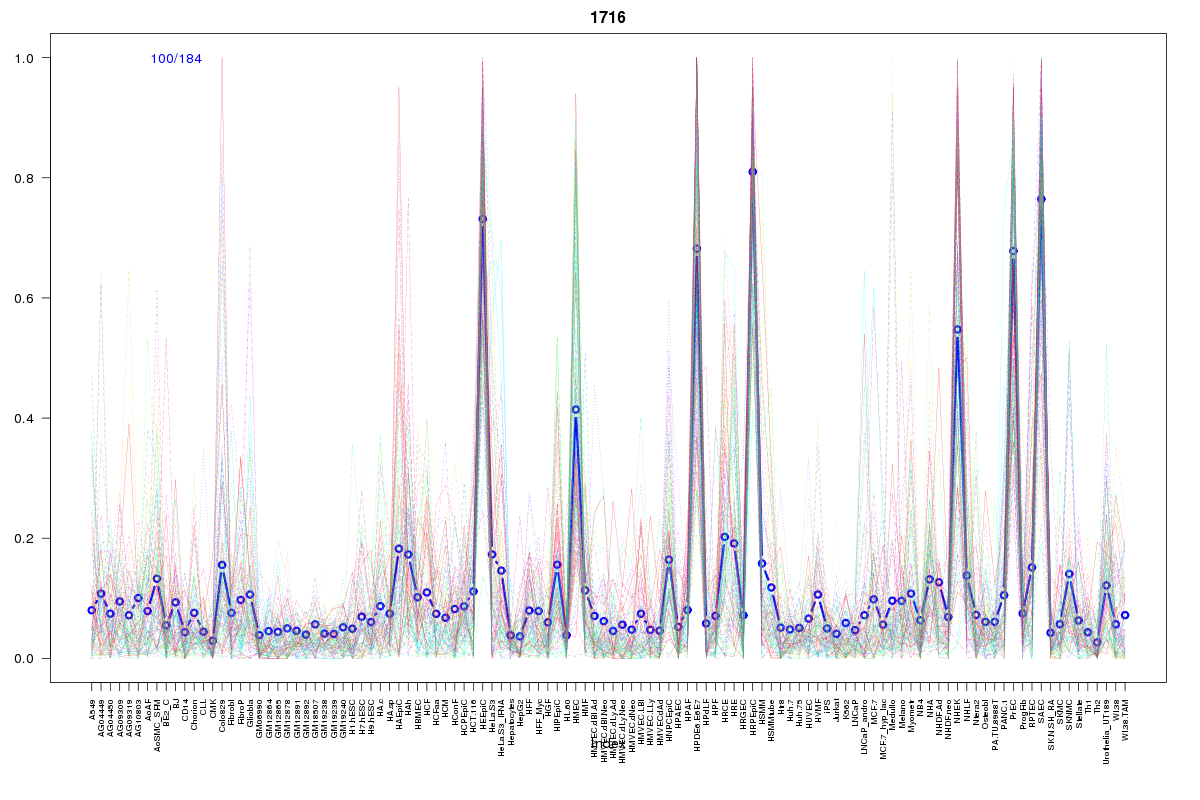
Cluster Hypersensitivity Profile

Genomic Location Trend
These plots show the distribution of the DHS sites surrounding the Transcript Start Site of the nearest gene.
Stats
Number of sites: 184Promoter: 2%
CpG-Island: 0%
Conserved: 39%
Enriched Motifs & Matches
Match Detail: [Jaspar]
|
| ||
|---|---|---|
| Sites: 50/100 | e-val: 0.000000053 | ||
| Factor | e-val(match) | DB |
| AP1 | 0.00000000038444 | JASPAR |
| NFE2L2 | 0.0000013644 | JASPAR |
| PPARG | 0.00018959 | JASPAR |
| RORA_2 | 0.012994 | JASPAR |
| NFE2L1::MafG | 0.018202 | JASPAR |
BED file downloads
Top 10 Example Regions
| Location | Gene Link | Dist. |
|---|---|---|
| chr8: 95704540-95704690 | ESRP1 | 42.06 |
| chr1: 94158020-94158170 | RP11-488P3.1 | 49.71 |
| chr16: 53779740-53779890 | RPGRIP1L | 56.11 |
| chr1: 94993005-94993155 | F3 | 63.13 |
| chr1: 94993005-94993155 | RP11-86H7.7 | 63.13 |
| chr4: 89533720-89533870 | HERC3 | 65.82 |
| chr4: 89533720-89533870 | FAM13A-AS1 | 65.82 |
| chr4: 89533720-89533870 | RP11-466G12.2 | 65.82 |
| chr10: 23673360-23673510 | OTUD1 | 67.09 |
| chr10: 23673360-23673510 | RP11-371A19.2 | 67.09 |