SOM cluster: 1710
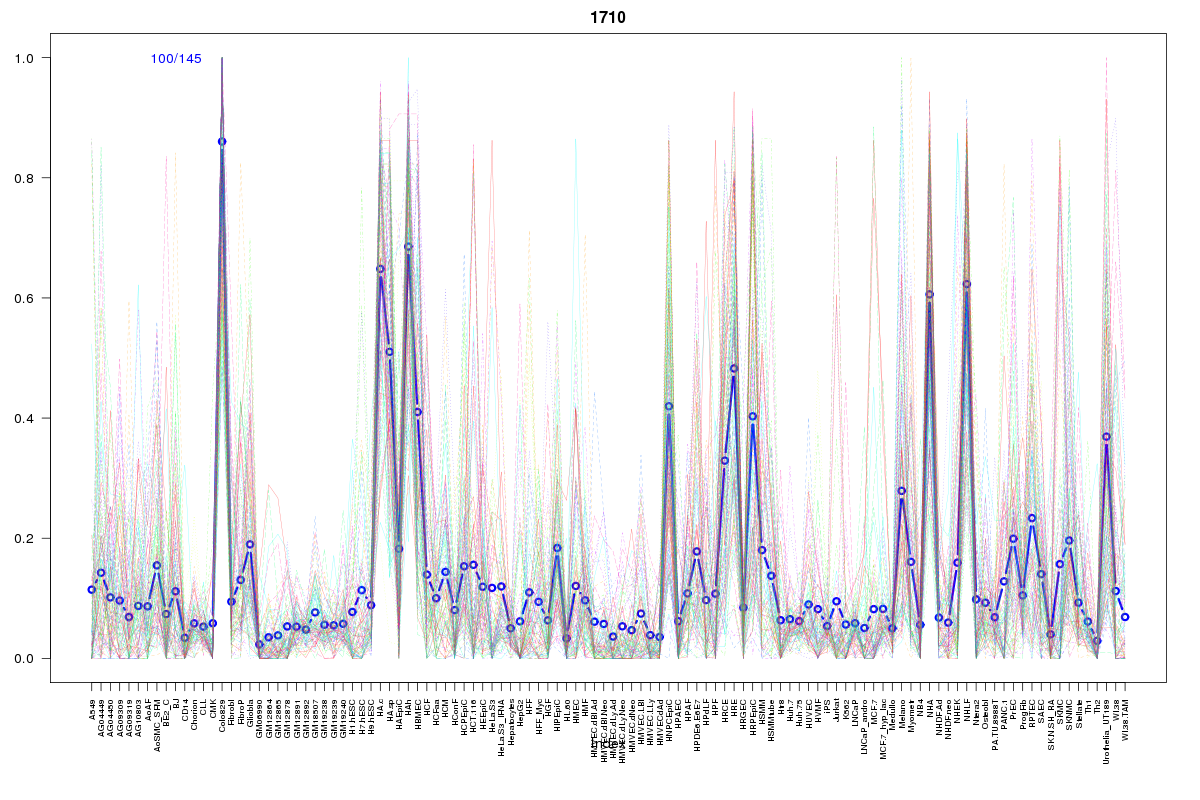
Cluster Hypersensitivity Profile

Genomic Location Trend
These plots show the distribution of the DHS sites surrounding the Transcript Start Site of the nearest gene.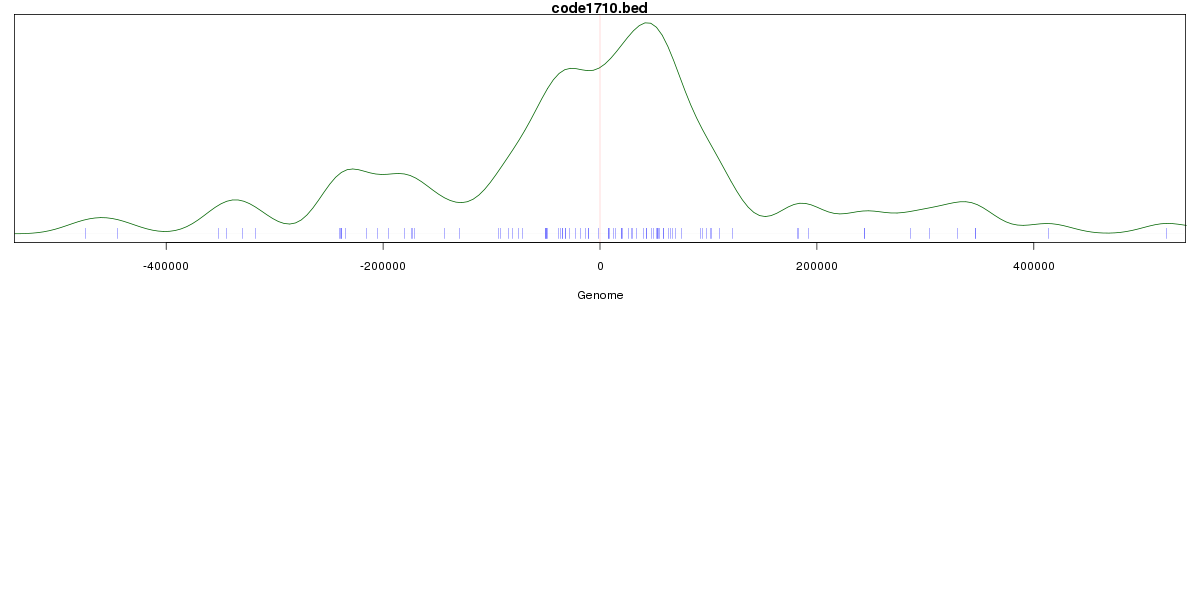
Stats
Number of sites: 145Promoter: 1%
CpG-Island: 0%
Conserved: 46%
Enriched Motifs & Matches
Match Detail: [Jaspar]
|
| ||
|---|---|---|
| Sites: 47/100 | e-val: 1.3e-16 | ||
| Factor | e-val(match) | DB |
| AP1 | 0.000000000062068 | JASPAR |
| NFE2L2 | 0.00000000011436 | JASPAR |
| NFE2L1::MafG | 0.000076607 | JASPAR |
| PBX1 | 0.00049262 | JASPAR |
| Pax2 | 0.0083163 | JASPAR |
BED file downloads
Top 10 Example Regions
| Location | Gene Link | Dist. |
|---|---|---|
| chr10: 16909560-16909710 | RSU1 | 47.11 |
| chr12: 79311040-79311190 | SYT1 | 64.15 |
| chr6: 11161605-11161755 | snoU13 | 64.87 |
| chr4: 23857940-23858090 | PPARGC1A | 67.58 |
| chr18: 5584880-5585030 | EPB41L3 | 71.93 |
| chr8: 113685960-113686110 | CSMD3 | 78.06 |
| chrX: 132536120-132536270 | GPC4 | 78.9 |
| chr10: 101426820-101426970 | ENTPD7 | 79.37 |
| chr13: 88313860-88314010 | SLITRK5 | 85.09 |
| chr7: 94964325-94964475 | PON2 | 87.11 |