SOM cluster: 1693
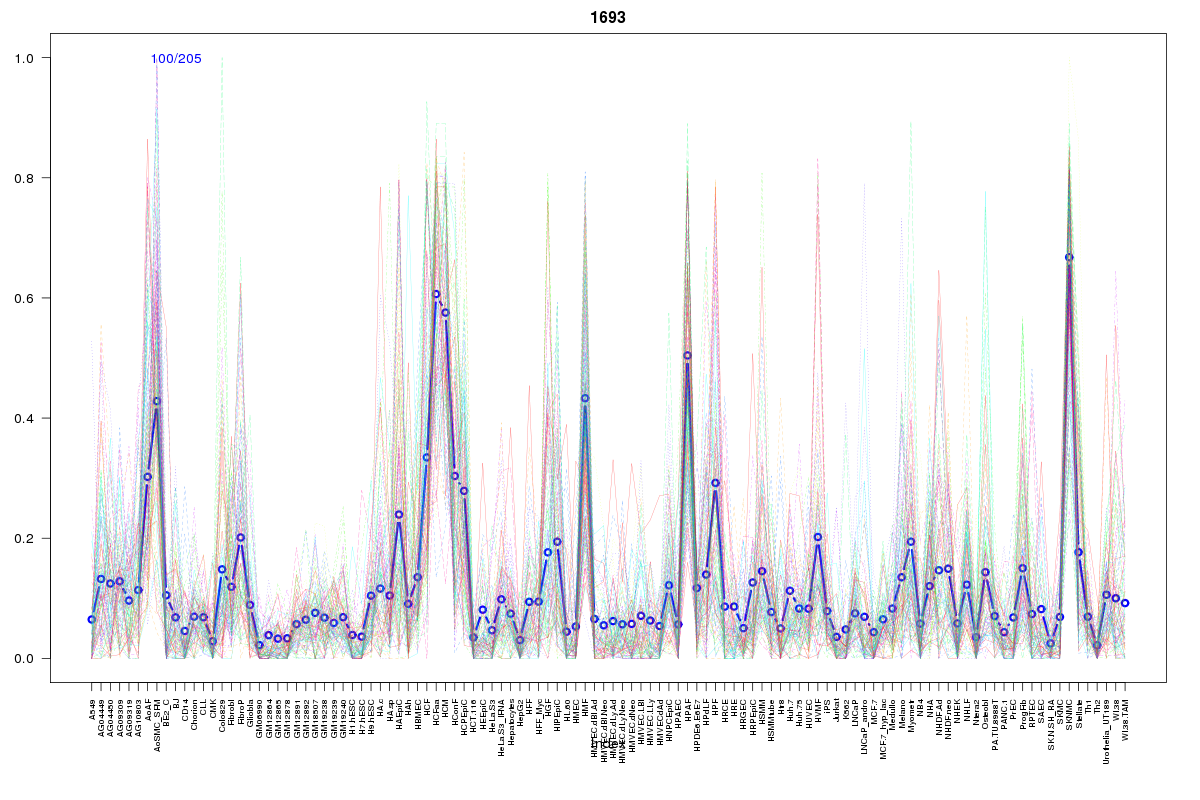
Cluster Hypersensitivity Profile

Genomic Location Trend
These plots show the distribution of the DHS sites surrounding the Transcript Start Site of the nearest gene.
Stats
Number of sites: 205Promoter: 1%
CpG-Island: 0%
Conserved: 32%
Enriched Motifs & Matches
Match Detail: [Jaspar]
|
| ||
|---|---|---|
| Sites: 23/100 | e-val: 1.3 | ||
| Factor | e-val(match) | DB |
| FOXA1 | 0.00054299 | JASPAR |
| NR4A2 | 0.0014726 | JASPAR |
| Pax4 | 0.0020152 | JASPAR |
| Foxd3 | 0.0023416 | JASPAR |
| Foxa2 | 0.0024616 | JASPAR |
BED file downloads
Top 10 Example Regions
| Location | Gene Link | Dist. |
|---|---|---|
| chrX: 54800940-54801090 | ITIH6 | 41.55 |
| chr8: 48594780-48594930 | CEBPD | 46.28 |
| chr17: 15339800-15339950 | CDRT4 | 54.95 |
| chr17: 15339800-15339950 | RN7SL792P | 54.95 |
| chr18: 74200300-74200450 | ZNF516 | 58.62 |
| chr3: 196415545-196415695 | LINC01063 | 60.71 |
| chr3: 177677960-177678110 | RP11-91K9.1 | 67.16 |
| chr5: 55350580-55350730 | ANKRD55 | 70.41 |
| chr4: 1845680-1845830 | WHSC1 | 72.52 |
| chr4: 1845680-1845830 | TACC3 | 72.52 |