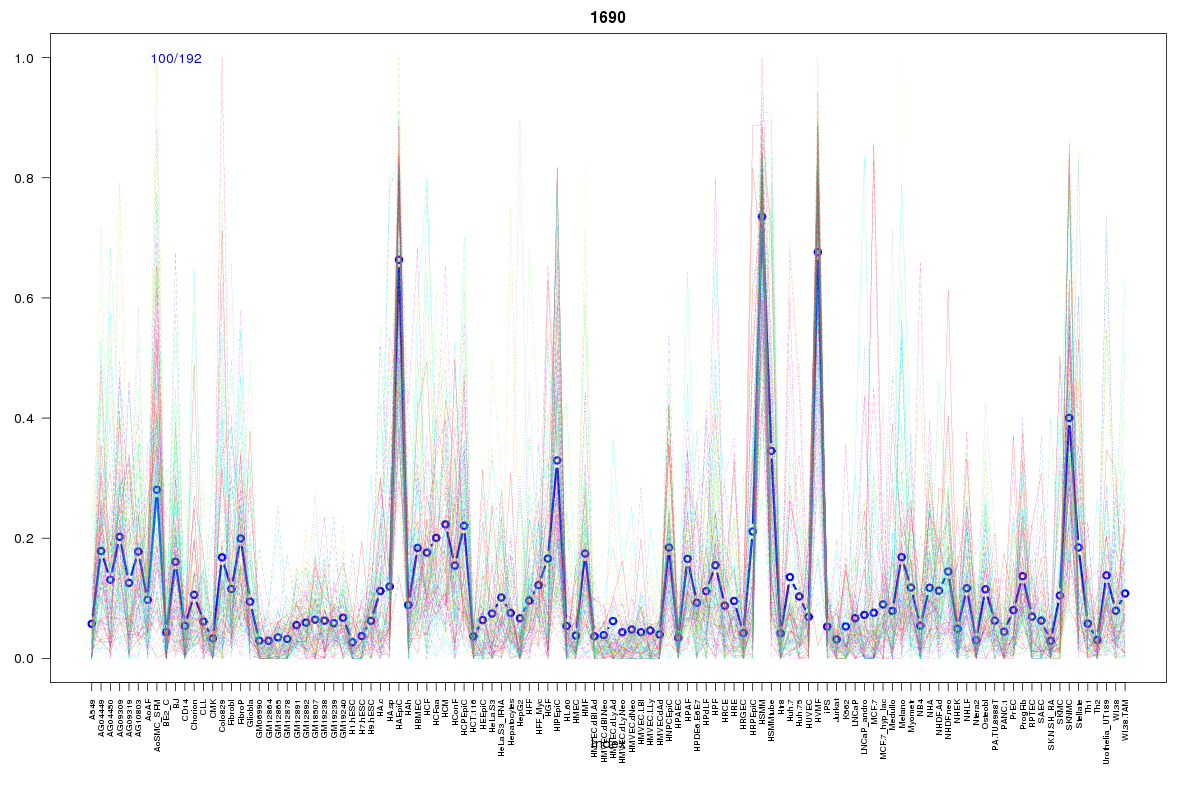
SOM cluster: 1690
Cluster Hypersensitivity Profile

Genomic Location Trend
These plots show the distribution of the DHS sites surrounding the Transcript Start Site of the nearest gene.
Stats
Number of sites: 192Promoter: 0%
CpG-Island: 0%
Conserved: 34%
Enriched Motifs & Matches
Match Detail: [Jaspar]
|
| ||
|---|---|---|
| Sites: 21/100 | e-val: 0.32 | ||
| Factor | e-val(match) | DB |
| NFATC2 | 0.0012894 | JASPAR |
| Pax5 | 0.0024606 | JASPAR |
| Foxd3 | 0.0032012 | JASPAR |
| Pax6 | 0.018053 | JASPAR |
| FOXO3 | 0.01808 | JASPAR |
BED file downloads
Top 10 Example Regions
| Location | Gene Link | Dist. |
|---|---|---|
| chr14: 35521100-35521250 | FAM177A1 | 64.59 |
| chr11: 114034680-114034830 | ZBTB16 | 70.77 |
| chr14: 75616960-75617110 | ACYP1 | 72.27 |
| chr1: 201903260-201903410 | SHISA4 | 73.05 |
| chr1: 201903260-201903410 | RP11-307B6.3 | 73.05 |
| chr1: 201903260-201903410 | RP11-510N19.5 | 73.05 |
| chr9: 89590600-89590750 | GAS1 | 83.86 |
| chr3: 106982580-106982730 | LINC00883 | 88.03 |
| chr5: 126694680-126694830 | MEGF10 | 90.78 |
| chr1: 116304360-116304510 | CASQ2 | 91.99 |