SOM cluster: 1683
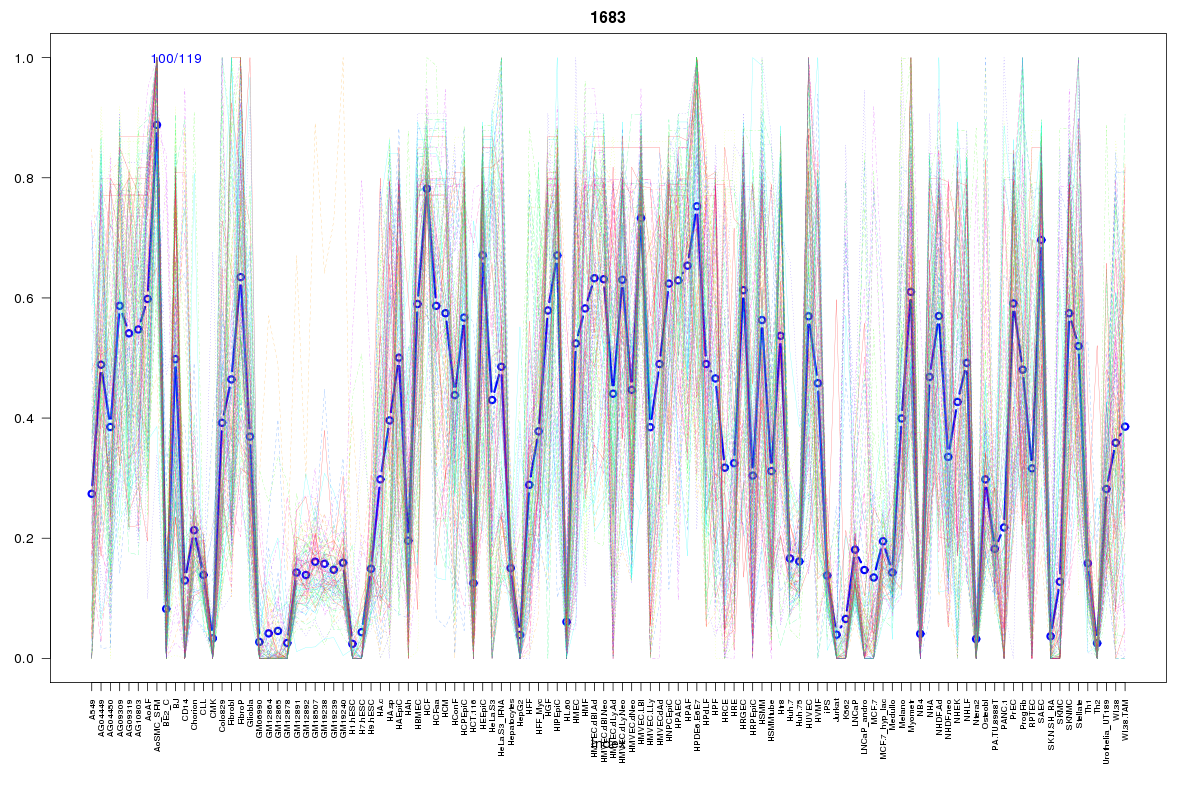
Cluster Hypersensitivity Profile

Genomic Location Trend
These plots show the distribution of the DHS sites surrounding the Transcript Start Site of the nearest gene.
Stats
Number of sites: 119Promoter: 3%
CpG-Island: 0%
Conserved: 44%
Enriched Motifs & Matches
Match Detail: [Jaspar]
|
| ||
|---|---|---|
| Sites: 49/100 | e-val: 0.000000000015 | ||
| Factor | e-val(match) | DB |
| AP1 | 0.00000000015136 | JASPAR |
| NFE2L2 | 0.000000013181 | JASPAR |
| Foxa2 | 0.0036555 | JASPAR |
| PPARG | 0.0059389 | JASPAR |
| NFE2L1::MafG | 0.0060002 | JASPAR |
|
| ||
| Sites: 33/100 | e-val: 0.00000000045 | ||
| Factor | e-val(match) | DB |
| Foxd3 | 0.000027921 | JASPAR |
| Foxq1 | 0.000029031 | JASPAR |
| Pax4 | 0.00058051 | JASPAR |
| FOXA1 | 0.00067724 | JASPAR |
| FOXI1 | 0.0013839 | JASPAR |
BED file downloads
Top 10 Example Regions
| Location | Gene Link | Dist. |
|---|---|---|
| chr11: 58161800-58161950 | AP000435.3 | 49.48 |
| chr6: 113735860-113736010 | RP11-437J19.1 | 66.37 |
| chr9: 16532780-16532930 | BNC2 | 69.92 |
| chr15: 76214760-76214910 | UBE2Q2 | 70.23 |
| chr5: 15835100-15835250 | FBXL7 | 72.29 |
| chr10: 112336100-112336250 | SMC3 | 72.97 |
| chr10: 112336100-112336250 | RBM20 | 72.97 |
| chr10: 112336100-112336250 | RPL7P35 | 72.97 |
| chr10: 112336100-112336250 | snoU13 | 72.97 |
| chr3: 169172760-169172910 | MECOM | 75.09 |