SOM cluster: 1682
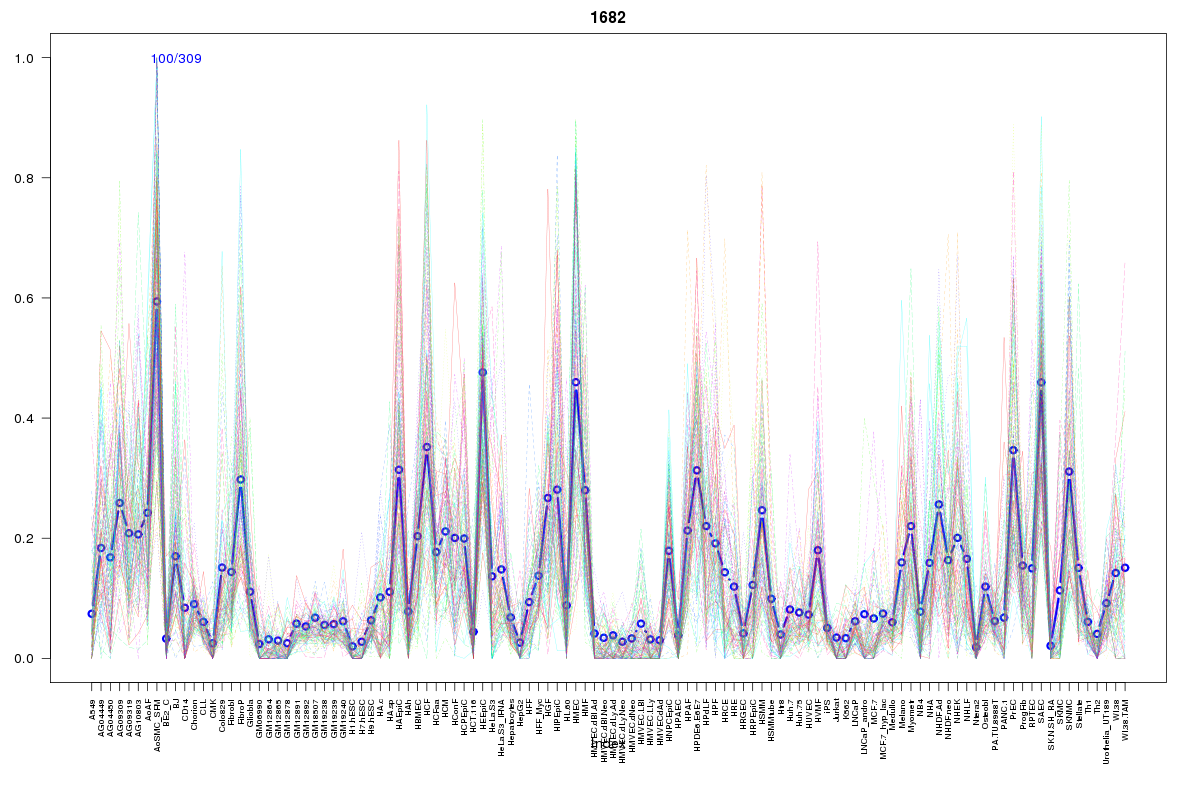
Cluster Hypersensitivity Profile

Genomic Location Trend
These plots show the distribution of the DHS sites surrounding the Transcript Start Site of the nearest gene.
Stats
Number of sites: 309Promoter: 2%
CpG-Island: 0%
Conserved: 23%
Enriched Motifs & Matches
Match Detail: [Jaspar]
|
| ||
|---|---|---|
| Sites: 55/100 | e-val: 0.0000000011 | ||
| Factor | e-val(match) | DB |
| HNF1A | 0.0000068816 | JASPAR |
| CEBPA | 0.000088306 | JASPAR |
| Lhx3 | 0.00011973 | JASPAR |
| Prrx2 | 0.00012581 | JASPAR |
| NFIL3 | 0.00029245 | JASPAR |
|
| ||
| Sites: 31/100 | e-val: 0.0094 | ||
| Factor | e-val(match) | DB |
| Sox2 | 0.0011671 | JASPAR |
| Foxd3 | 0.0013506 | JASPAR |
| Lhx3 | 0.0021522 | JASPAR |
| NFATC2 | 0.0027762 | JASPAR |
| MEF2A | 0.0036368 | JASPAR |
BED file downloads
Top 10 Example Regions
| Location | Gene Link | Dist. |
|---|---|---|
| chr8: 19521700-19521850 | RP11-1105O14.1 | 39.23 |
| chr19: 52589860-52590010 | ZNF432 | 40.41 |
| chr19: 52589860-52590010 | ZNF841 | 40.41 |
| chrX: 16661480-16661630 | CTPS2 | 54.44 |
| chr2: 97580200-97580350 | CNNM3 | 55.23 |
| chr2: 97580200-97580350 | ANKRD39 | 55.23 |
| chr12: 86223300-86223450 | RASSF9 | 56.88 |
| chr1: 13977920-13978070 | PDPN | 61.08 |
| chr1: 167532060-167532210 | CREG1 | 63.84 |
| chr8: 127869600-127869750 | PCAT1 | 65.69 |