SOM cluster: 1668
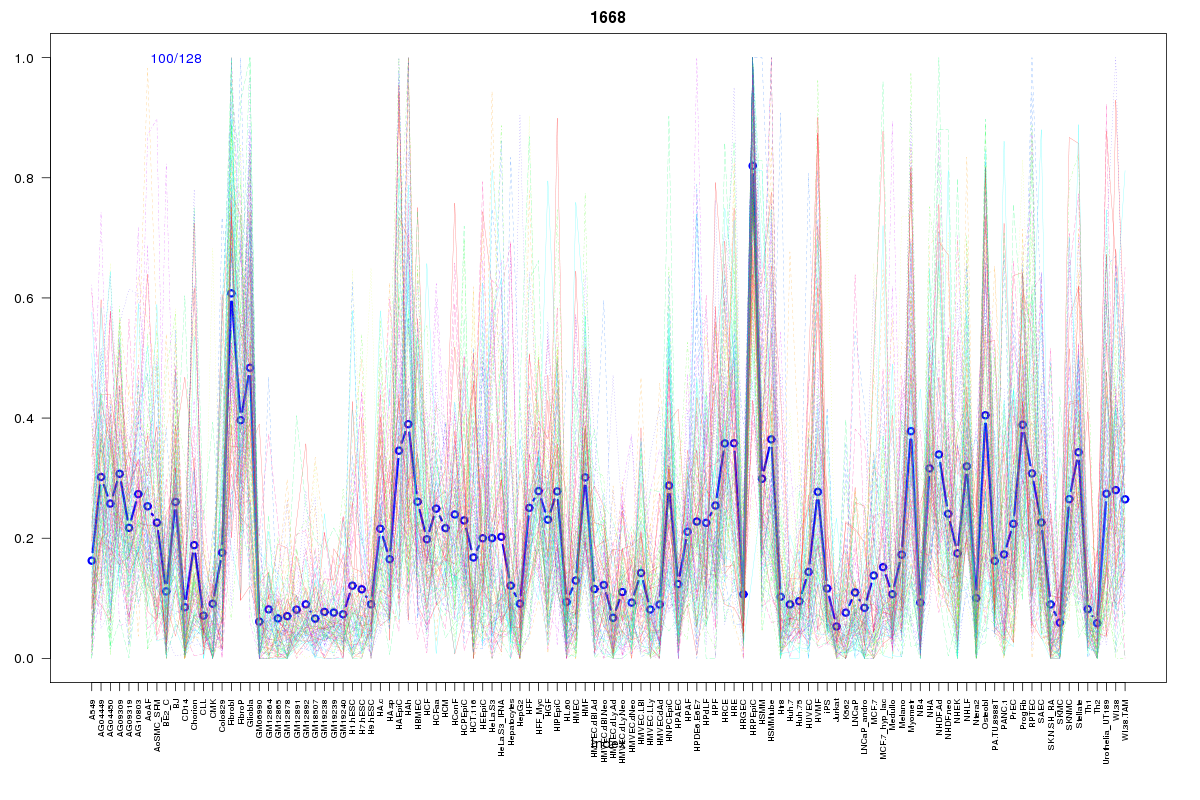
Cluster Hypersensitivity Profile

Genomic Location Trend
These plots show the distribution of the DHS sites surrounding the Transcript Start Site of the nearest gene.
Stats
Number of sites: 128Promoter: 2%
CpG-Island: 0%
Conserved: 28%
Enriched Motifs & Matches
Match Detail: [Jaspar]
|
| ||
|---|---|---|
| Sites: 27/100 | e-val: 0.00000000061 | ||
| Factor | e-val(match) | DB |
| AP1 | 0.000000000025742 | JASPAR |
| NFE2L2 | 0.0000000068398 | JASPAR |
| PPARG | 0.0025385 | JASPAR |
| NFE2L1::MafG | 0.0047519 | JASPAR |
| RORA_2 | 0.013255 | JASPAR |
BED file downloads
Top 10 Example Regions
| Location | Gene Link | Dist. |
|---|---|---|
| chr9: 132880140-132880290 | NCS1 | 50.03 |
| chr2: 62688980-62689130 | TMEM17 | 50.55 |
| chr8: 38795405-38795555 | TM2D2 | 55.56 |
| chr8: 38795405-38795555 | PLEKHA2 | 55.56 |
| chr8: 38795405-38795555 | RP11-723D22.3 | 55.56 |
| chr3: 49987820-49987970 | CTD-2330K9.3 | 56.79 |
| chr3: 49987820-49987970 | RBM6 | 56.79 |
| chr3: 49987820-49987970 | CAMKV | 56.79 |
| chr3: 49987820-49987970 | TRAIP | 56.79 |
| chr18: 21851000-21851150 | OSBPL1A | 58.74 |