SOM cluster: 1665
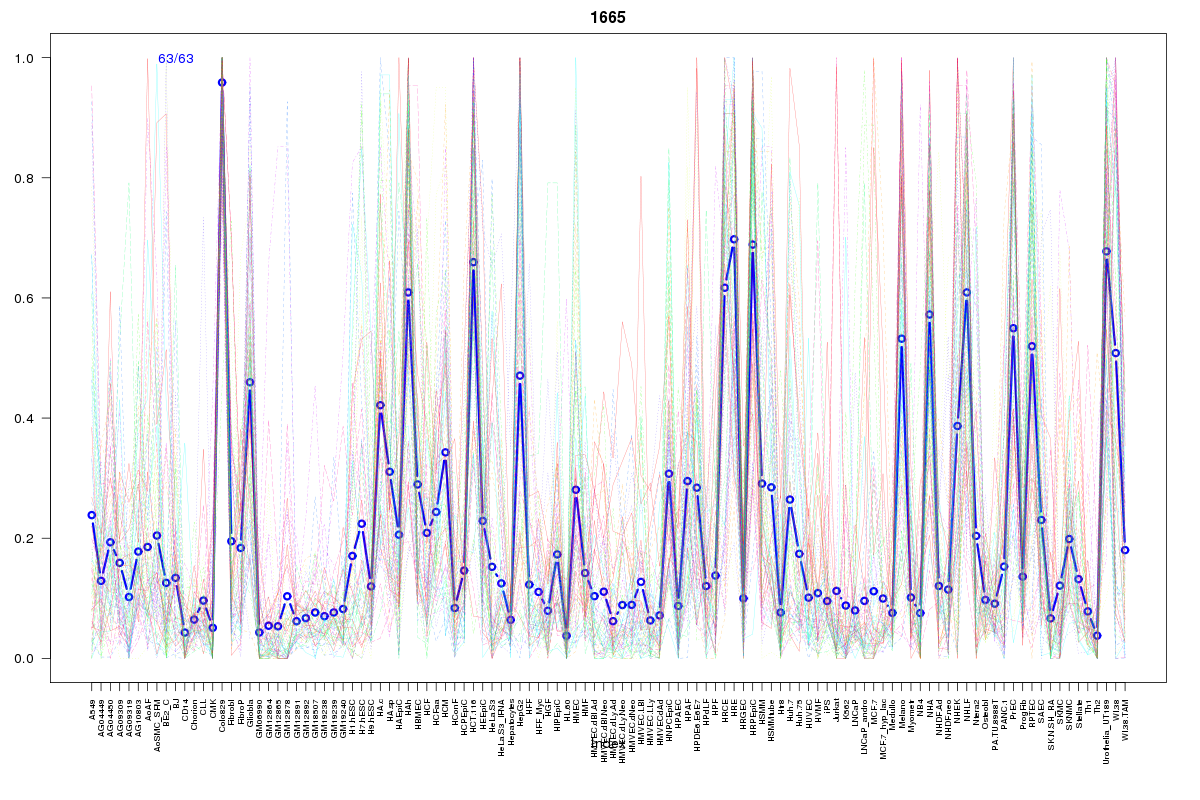
Cluster Hypersensitivity Profile

Genomic Location Trend
These plots show the distribution of the DHS sites surrounding the Transcript Start Site of the nearest gene.
Stats
Number of sites: 63Promoter: 0%
CpG-Island: 1%
Conserved: 38%
Enriched Motifs & Matches
Match Detail: [Jaspar]
|
| ||
|---|---|---|
| Sites: 35/63 | e-val: 2.2e-18 | ||
| Factor | e-val(match) | DB |
| SOX10 | 0.0000016837 | JASPAR |
| SOX9 | 0.0000083396 | JASPAR |
| Sox5 | 0.00036573 | JASPAR |
| Sox2 | 0.0023998 | JASPAR |
| SRY | 0.0042316 | JASPAR |
|
| ||
| Sites: 9/63 | e-val: 0.71 | ||
| Factor | e-val(match) | DB |
| SP1 | 0.0000046113 | JASPAR |
| RREB1 | 0.000004797 | JASPAR |
| Pax4 | 0.000011787 | JASPAR |
| EWSR1-FLI1 | 0.000028791 | JASPAR |
| PPARG::RXRA | 0.0066008 | JASPAR |
BED file downloads
Top 10 Example Regions
| Location | Gene Link | Dist. |
|---|---|---|
| chr5: 112538920-112539070 | MCC | 53.19 |
| chr9: 37964140-37964290 | SHB | 57.03 |
| chr9: 37964140-37964290 | SLC25A51 | 57.03 |
| chr9: 37964140-37964290 | PAICSP1 | 57.03 |
| chr9: 37964140-37964290 | RP11-613M10.9 | 57.03 |
| chr4: 10047220-10047370 | WDR1 | 64.62 |
| chr4: 10047220-10047370 | SLC2A9 | 64.62 |
| chr11: 94882800-94882950 | SRSF8 | 68.99 |
| chr11: 94882800-94882950 | ENDOD1 | 68.99 |
| chr17: 70611180-70611330 | LINC00511 | 72.29 |