SOM cluster: 166
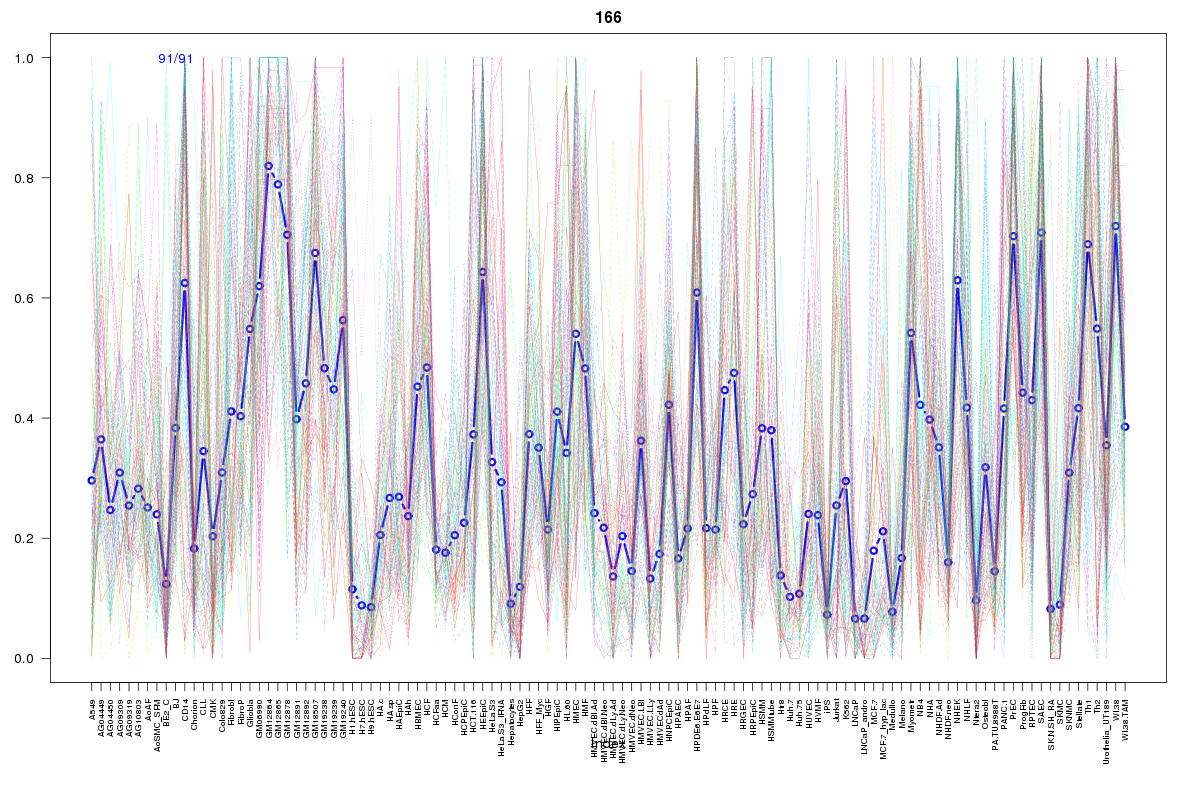
Cluster Hypersensitivity Profile

Genomic Location Trend
These plots show the distribution of the DHS sites surrounding the Transcript Start Site of the nearest gene.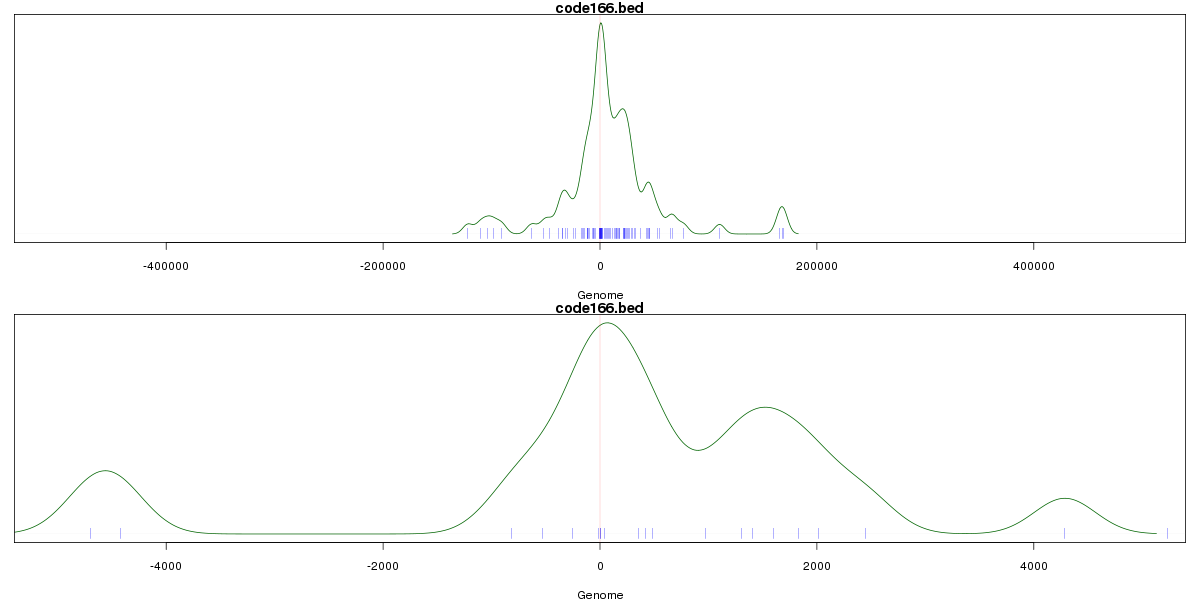
Stats
Number of sites: 91Promoter: 9%
CpG-Island: 2%
Conserved: 37%
Enriched Motifs & Matches
Match Detail: [Jaspar]
|
| ||
|---|---|---|
| Sites: 59/91 | e-val: 7.4e-29 | ||
| Factor | e-val(match) | DB |
| AP1 | 0.000000000045451 | JASPAR |
| NFE2L2 | 0.0000000045341 | JASPAR |
| PPARG | 0.0040593 | JASPAR |
| NFE2L1::MafG | 0.0043508 | JASPAR |
| Foxa2 | 0.010519 | JASPAR |
BED file downloads
Top 10 Example Regions
| Location | Gene Link | Dist. |
|---|---|---|
| chr12: 31916160-31916310 | METTL20 | 39.05 |
| chr4: 99851280-99851430 | NDUFS5P4 | 39.7 |
| chr21: 35348560-35348710 | MRPS6 | 43.44 |
| chr21: 35348560-35348710 | SLC5A3 | 43.44 |
| chr3: 37216400-37216550 | UBE2FP1 | 47 |
| chr4: 26199245-26199395 | RBPJ | 52.39 |
| chr19: 35896380-35896530 | AC002511.2 | 52.76 |
| chr1: 209780840-209780990 | G0S2 | 66.03 |
| chr1: 209780840-209780990 | LAMB3 | 66.03 |
| chr13: 30946060-30946210 | LINC01058 | 68.09 |