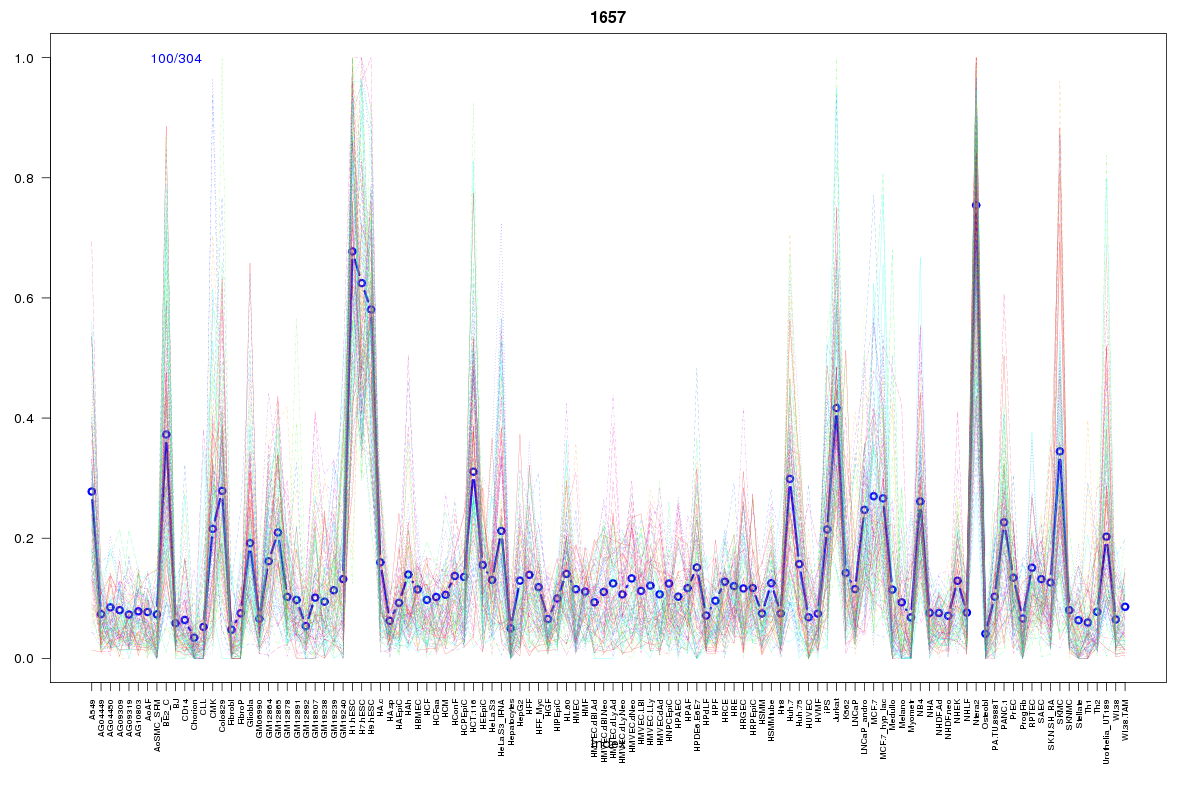
SOM cluster: 1657
Cluster Hypersensitivity Profile

Genomic Location Trend
These plots show the distribution of the DHS sites surrounding the Transcript Start Site of the nearest gene.
Stats
Number of sites: 304Promoter: 0%
CpG-Island: 0%
Conserved: 25%
Enriched Motifs & Matches
Match Detail: [Jaspar]
|
| ||
|---|---|---|
| Sites: 35/100 | e-val: 1.7e-24 | ||
| Factor | e-val(match) | DB |
| CTCF | 0 | JASPAR |
| INSM1 | 0.0000023615 | JASPAR |
| Zfp423 | 0.00052381 | JASPAR |
| PLAG1 | 0.00052972 | JASPAR |
| SP1 | 0.00064712 | JASPAR |
|
| ||
| Sites: 10/100 | e-val: 0.0000000000087 | ||
| Factor | e-val(match) | DB |
| REST | 0 | JASPAR |
| RXR::RAR_DR5 | 0.00017343 | JASPAR |
| NR1H2::RXRA | 0.0080107 | JASPAR |
| TLX1::NFIC | 0.011374 | JASPAR |
| REL | 0.025818 | JASPAR |
BED file downloads
Top 10 Example Regions
| Location | Gene Link | Dist. |
|---|---|---|
| chr12: 109006700-109006850 | SELPLG | 47.01 |
| chrX: 133160800-133160950 | AF003529.2 | 60.41 |
| chr9: 38708040-38708190 | ANKRD18A | 62.01 |
| chr9: 38708040-38708190 | RNU6-765P | 62.01 |
| chr1: 58621100-58621250 | DAB1 | 66.93 |
| chr1: 58621100-58621250 | RP11-414C16.1 | 66.93 |
| chr2: 17652260-17652410 | VSNL1 | 67.98 |
| chrX: 119453300-119453450 | TMEM255A | 68.83 |
| chrX: 119453300-119453450 | ZBTB33 | 68.83 |
| chr2: 106781620-106781770 | UXS1 | 71.21 |