SOM cluster: 1654
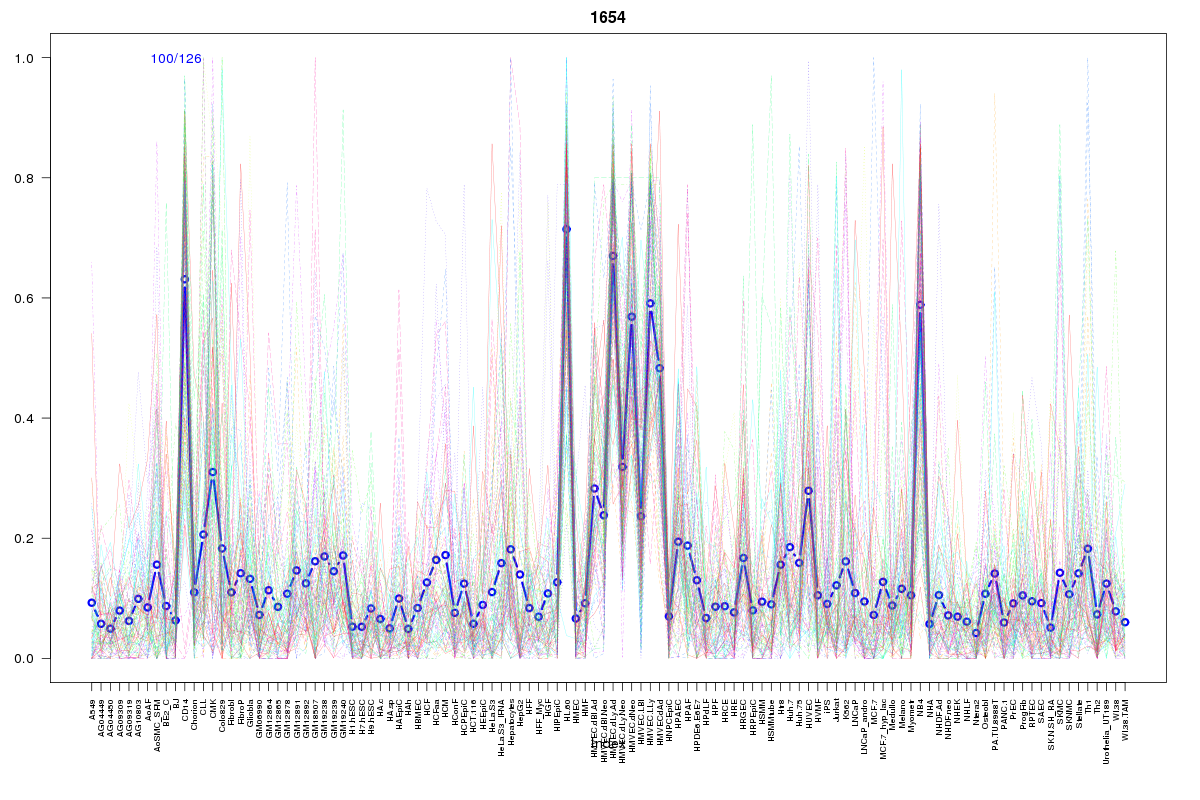
Cluster Hypersensitivity Profile

Genomic Location Trend
These plots show the distribution of the DHS sites surrounding the Transcript Start Site of the nearest gene.
Stats
Number of sites: 126Promoter: 2%
CpG-Island: 2%
Conserved: 38%
Enriched Motifs & Matches
Match Detail: [Jaspar]
|
| ||
|---|---|---|
| Sites: 50/100 | e-val: 2.2e-28 | ||
| Factor | e-val(match) | DB |
| SPIB | 0.0000019332 | JASPAR |
| FEV | 0.000016842 | JASPAR |
| SPI1 | 0.000018056 | JASPAR |
| ELK4 | 0.000047522 | JASPAR |
| Stat3 | 0.00028566 | JASPAR |
BED file downloads
Top 10 Example Regions
| Location | Gene Link | Dist. |
|---|---|---|
| chr3: 194821740-194821890 | XXYLT1-AS1 | 50.18 |
| chr7: 38350200-38350350 | STARD3NL | 61.43 |
| chr7: 38350200-38350350 | TRGC1 | 61.43 |
| chr7: 38350200-38350350 | TRGJP1 | 61.43 |
| chr7: 38350200-38350350 | TRGV9 | 61.43 |
| chrX: 118110365-118110515 | LONRF3 | 71.42 |
| chr19: 19083280-19083430 | HOMER3 | 71.71 |
| chr7: 14791200-14791350 | DGKB | 75.08 |
| chr21: 35572700-35572850 | LINC00310 | 80.65 |
| chr3: 15336600-15336750 | SH3BP5 | 82.73 |