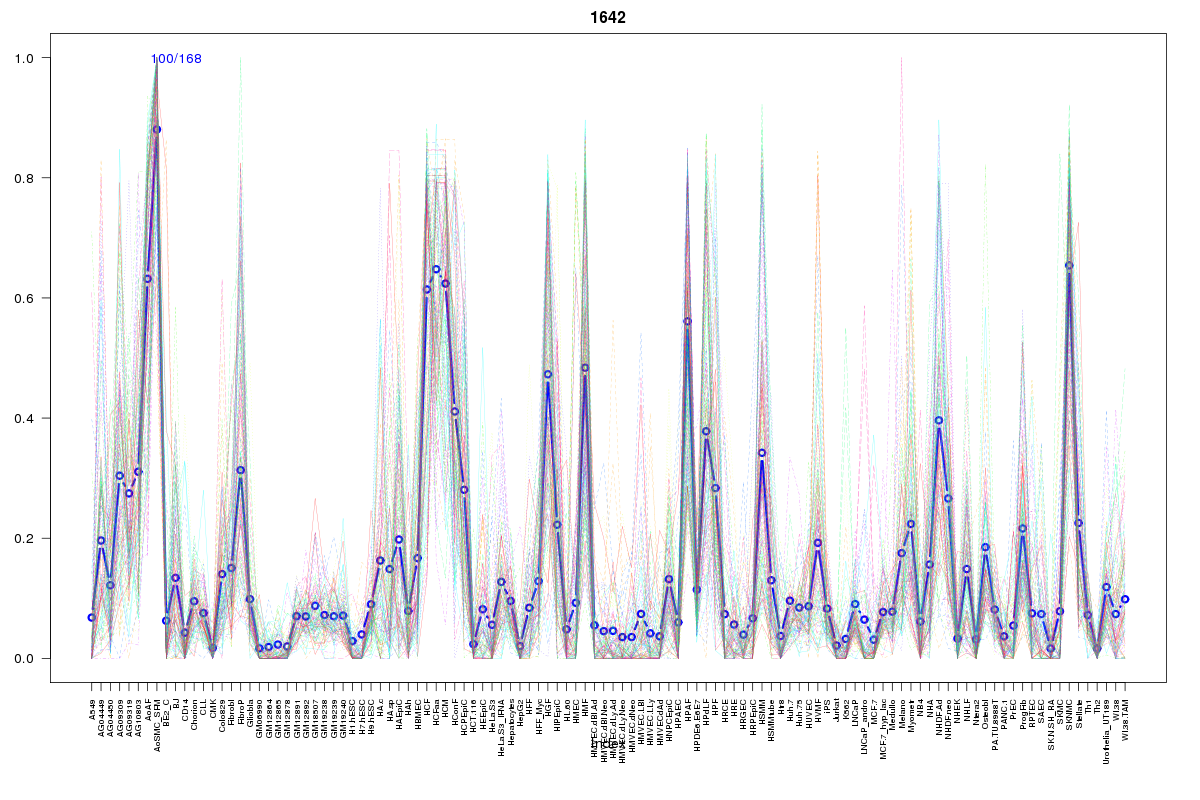
SOM cluster: 1642
Cluster Hypersensitivity Profile

Genomic Location Trend
These plots show the distribution of the DHS sites surrounding the Transcript Start Site of the nearest gene.
Stats
Number of sites: 168Promoter: 1%
CpG-Island: 0%
Conserved: 33%
Enriched Motifs & Matches
Match Detail: [Jaspar]
|
| ||
|---|---|---|
| Sites: 20/100 | e-val: 0.51 | ||
| Factor | e-val(match) | DB |
| Foxd3 | 0.000007439 | JASPAR |
| Foxq1 | 0.0002432 | JASPAR |
| NR3C1 | 0.0013601 | JASPAR |
| SRY | 0.011691 | JASPAR |
| Lhx3 | 0.012346 | JASPAR |
BED file downloads
Top 10 Example Regions
| Location | Gene Link | Dist. |
|---|---|---|
| chr1: 82145780-82145930 | ST13P20 | 33.13 |
| chr1: 197034800-197034950 | ASPM | 47.89 |
| chr3: 157160680-157160830 | PTX3 | 49.43 |
| chr3: 157160680-157160830 | VEPH1 | 49.43 |
| chr11: 1942900-1943050 | H19 | 58.68 |
| chr11: 1942900-1943050 | LINC01150 | 58.68 |
| chr12: 71439680-71439830 | CTD-2021H9.3 | 63.89 |
| chr1: 169480680-169480830 | CCDC181 | 66.2 |
| chr1: 169480680-169480830 | SELP | 66.2 |
| chr6: 4616220-4616370 | CDYL | 69.32 |