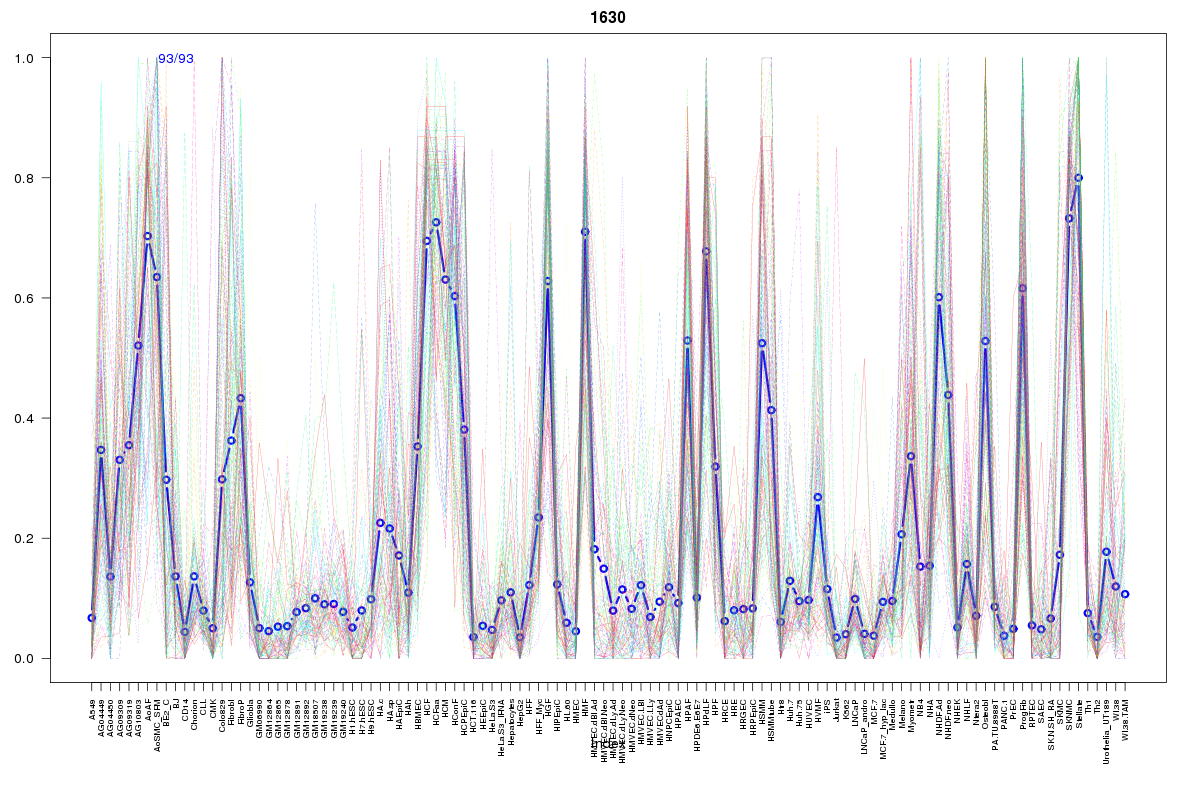
SOM cluster: 1630
Cluster Hypersensitivity Profile

Genomic Location Trend
These plots show the distribution of the DHS sites surrounding the Transcript Start Site of the nearest gene.
Stats
Number of sites: 93Promoter: 6%
CpG-Island: 0%
Conserved: 48%
Enriched Motifs & Matches
Match Detail: [Jaspar]
|
| ||
|---|---|---|
| Sites: 56/93 | e-val: 5.60001e-41 | ||
| Factor | e-val(match) | DB |
| EBF1 | 0.0000000011268 | JASPAR |
| INSM1 | 0.0016102 | JASPAR |
| Zfp423 | 0.0044288 | JASPAR |
| PLAG1 | 0.0046229 | JASPAR |
| MZF1_1-4 | 0.0091172 | JASPAR |
BED file downloads
Top 10 Example Regions
| Location | Gene Link | Dist. |
|---|---|---|
| chr9: 138701120-138701270 | CAMSAP1 | 43.3 |
| chr1: 178027400-178027550 | RASAL2-AS1 | 49.83 |
| chr1: 178027400-178027550 | RP11-568K15.1 | 49.83 |
| chr14: 52733020-52733170 | PTGER2 | 56.6 |
| chr14: 52733020-52733170 | PTGDR | 56.6 |
| chr11: 64428820-64428970 | NRXN2 | 57.47 |
| chr16: 4002900-4003050 | ADCY9 | 59.52 |
| chr7: 137642780-137642930 | CREB3L2 | 74.61 |
| chr10: 105455440-105455590 | SH3PXD2A | 74.65 |
| chr3: 45515460-45515610 | LARS2 | 76.68 |