SOM cluster: 1628
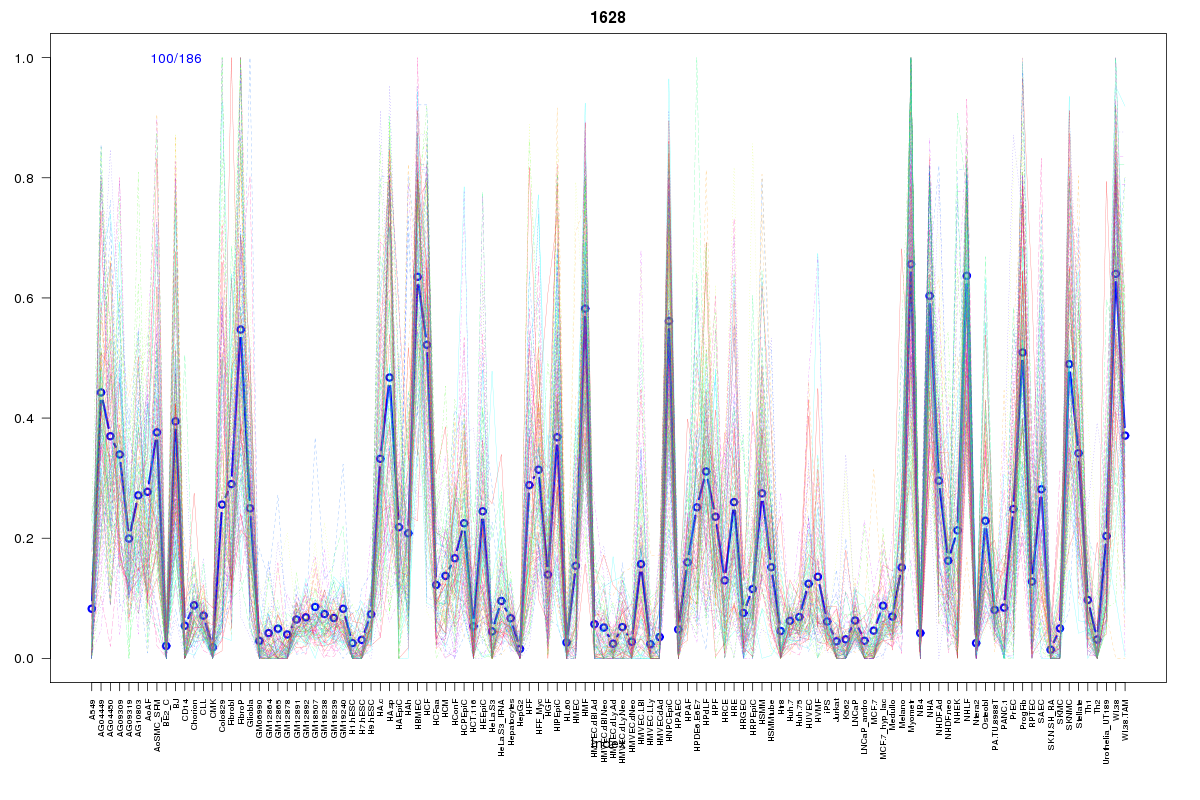
Cluster Hypersensitivity Profile

Genomic Location Trend
These plots show the distribution of the DHS sites surrounding the Transcript Start Site of the nearest gene.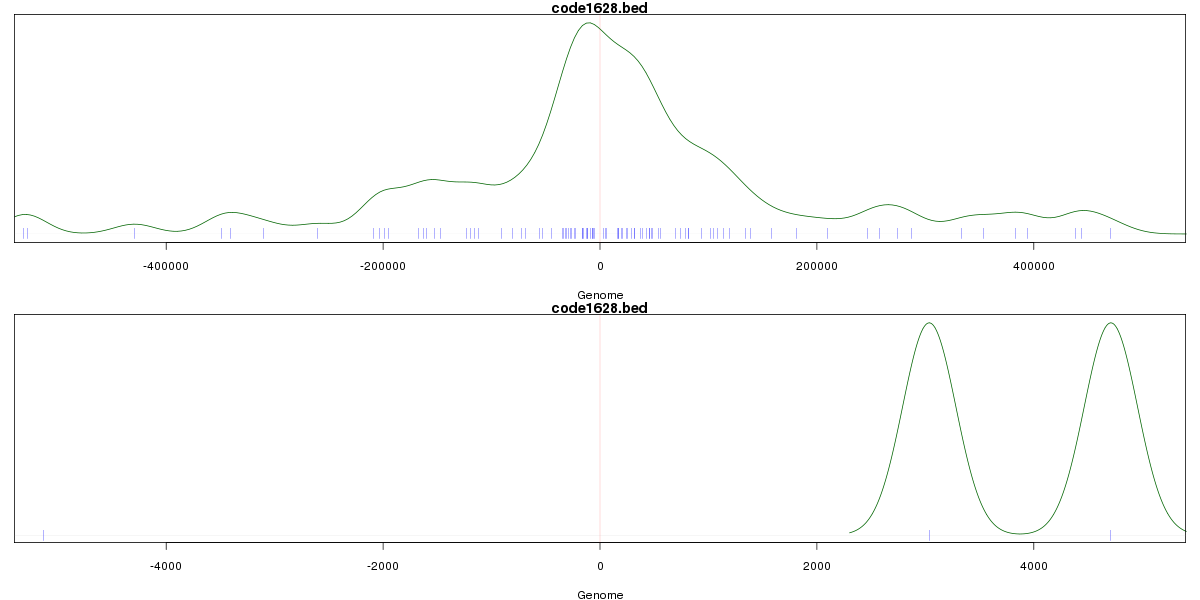
Stats
Number of sites: 186Promoter: 0%
CpG-Island: 0%
Conserved: 32%
Enriched Motifs & Matches
Match Detail: [Jaspar]
|
| ||
|---|---|---|
| Sites: 48/100 | e-val: 4.4e-21 | ||
| Factor | e-val(match) | DB |
| AP1 | 0.00000000022449 | JASPAR |
| NFE2L2 | 0.0000000054363 | JASPAR |
| NFE2L1::MafG | 0.0049146 | JASPAR |
| PPARG | 0.0068601 | JASPAR |
| CREB1 | 0.020826 | JASPAR |
BED file downloads
Top 10 Example Regions
| Location | Gene Link | Dist. |
|---|---|---|
| chr8: 89293540-89293690 | MMP16 | 43.3 |
| chr2: 75449160-75449310 | TACR1 | 43.54 |
| chr9: 119050080-119050230 | PAPPA | 51.25 |
| chr5: 72362440-72362590 | TMEM171 | 54.07 |
| chr2: 36757340-36757490 | CRIM1 | 54.27 |
| chr2: 36757340-36757490 | FEZ2 | 54.27 |
| chr2: 36757340-36757490 | AC007401.1 | 54.27 |
| chr3: 8559980-8560130 | LINC00312 | 54.34 |
| chr3: 8559980-8560130 | LMCD1 | 54.34 |
| chr6: 38230440-38230590 | BTBD9 | 54.52 |