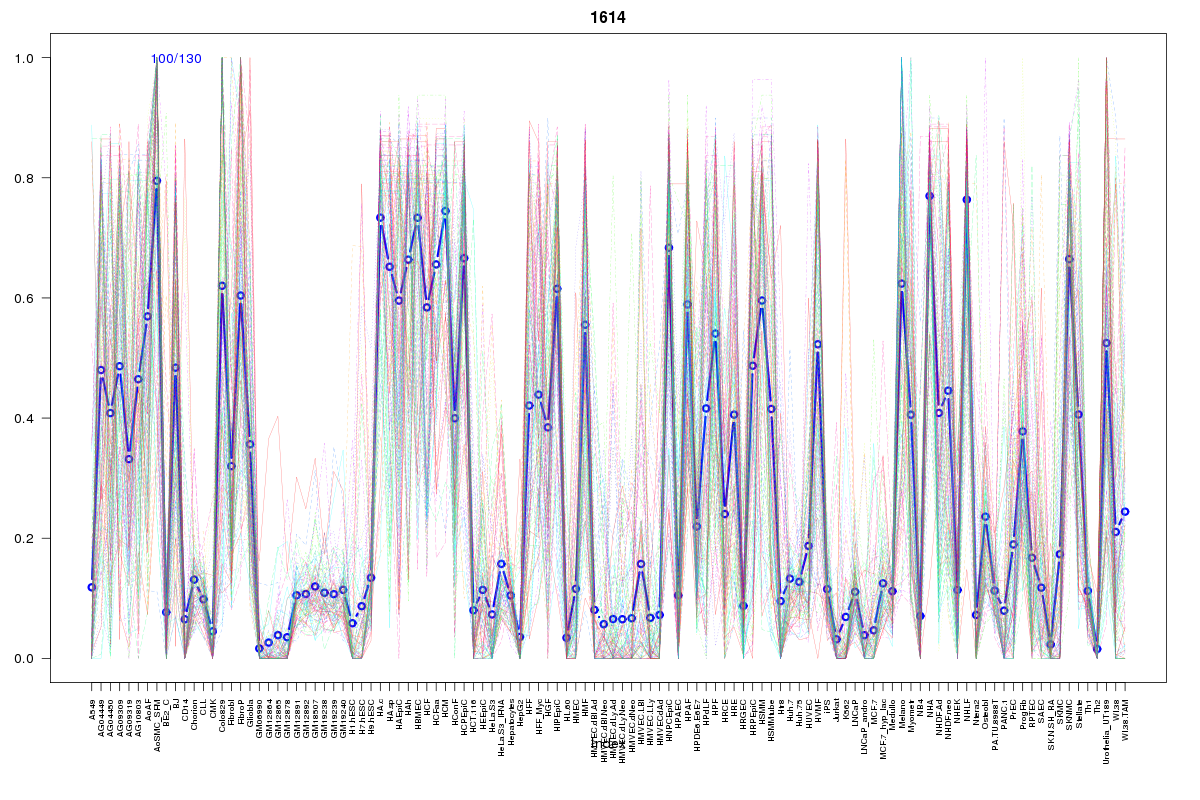
SOM cluster: 1614
Cluster Hypersensitivity Profile

Genomic Location Trend
These plots show the distribution of the DHS sites surrounding the Transcript Start Site of the nearest gene.
Stats
Number of sites: 130Promoter: 0%
CpG-Island: 0%
Conserved: 58%
Enriched Motifs & Matches
Match Detail: [Jaspar]
|
| ||
|---|---|---|
| Sites: 25/100 | e-val: 0.00000024 | ||
| Factor | e-val(match) | DB |
| RUNX1 | 0.00000018894 | JASPAR |
| RREB1 | 0.00099573 | JASPAR |
| ZNF354C | 0.0029971 | JASPAR |
| Pax4 | 0.033428 | JASPAR |
| Tcfcp2l1 | 0.045386 | JASPAR |
|
| ||
| Sites: 15/100 | e-val: 0.17 | ||
| Factor | e-val(match) | DB |
| Stat3 | 0.000024605 | JASPAR |
| NFATC2 | 0.000063027 | JASPAR |
| HOXA5 | 0.00041279 | JASPAR |
| znf143 | 0.0011238 | JASPAR |
| NFIL3 | 0.0049112 | JASPAR |
BED file downloads
Top 10 Example Regions
| Location | Gene Link | Dist. |
|---|---|---|
| chr10: 4358760-4358910 | LINC00702 | 34.78 |
| chr1: 162869560-162869710 | HSD17B7 | 39.18 |
| chr1: 162869560-162869710 | C1orf110 | 39.18 |
| chr22: 40350840-40350990 | RP3-370M22.8 | 50.35 |
| chr22: 40350840-40350990 | RN7SKP210 | 50.35 |
| chr22: 40350840-40350990 | GRAP2 | 50.35 |
| chr22: 40350840-40350990 | FAM83F | 50.35 |
| chr12: 78604840-78604990 | NAV3 | 52.28 |
| chr10: 20211660-20211810 | PLXDC2 | 59.96 |
| chr11: 131630120-131630270 | NTM | 61.19 |