SOM cluster: 1612
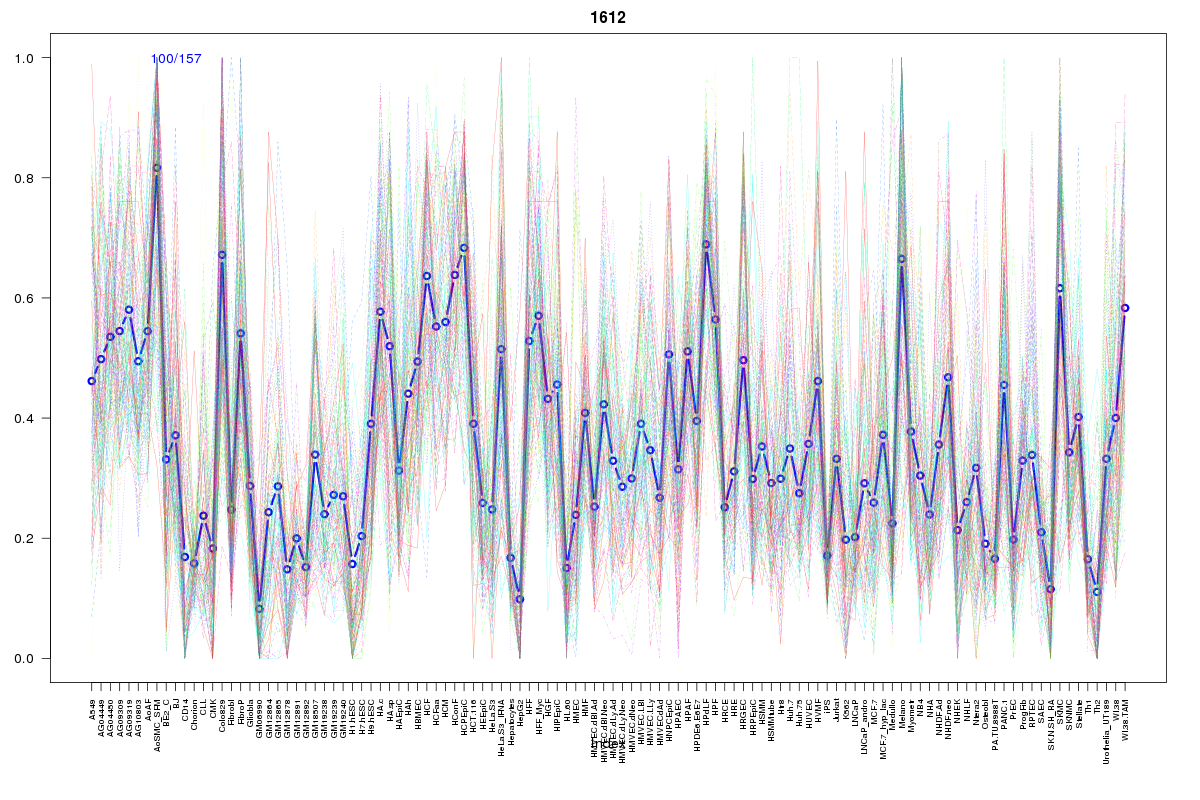
Cluster Hypersensitivity Profile

Genomic Location Trend
These plots show the distribution of the DHS sites surrounding the Transcript Start Site of the nearest gene.
Stats
Number of sites: 157Promoter: 1%
CpG-Island: 0%
Conserved: 88%
Enriched Motifs & Matches
Match Detail: [Jaspar]
|
| ||
|---|---|---|
| Sites: 71/100 | e-val: 0 | ||
| Factor | e-val(match) | DB |
| CTCF | 3.3307e-16 | JASPAR |
| Zfp423 | 0.0011298 | JASPAR |
| INSM1 | 0.0048461 | JASPAR |
| T | 0.0049212 | JASPAR |
| TAL1::TCF3 | 0.010125 | JASPAR |
|
| ||
| Sites: 68/100 | e-val: 0.0000000000045 | ||
| Factor | e-val(match) | DB |
| Foxd3 | 0.00000061966 | JASPAR |
| Sox2 | 0.0017118 | JASPAR |
| FOXI1 | 0.0018845 | JASPAR |
| Pou5f1 | 0.0020379 | JASPAR |
| Foxq1 | 0.0023798 | JASPAR |
|
| ||
| Sites: 15/100 | e-val: 0.38 | ||
| Factor | e-val(match) | DB |
| EWSR1-FLI1 | 0.000015947 | JASPAR |
| Lhx3 | 0.019144 | JASPAR |
| Pdx1 | 0.02938 | JASPAR |
| Foxa2 | 0.031141 | JASPAR |
| Pax6 | 0.032026 | JASPAR |
BED file downloads
Top 10 Example Regions
| Location | Gene Link | Dist. |
|---|---|---|
| chr4: 87419860-87420010 | PTPN13 | 42.33 |
| chr17: 15429980-15430130 | TVP23C | 59.99 |
| chrX: 103100200-103100350 | LL0XNC01-116E7.4 | 62.59 |
| chrX: 103100200-103100350 | RP11-370B6.1 | 62.59 |
| chr1: 210534260-210534410 | HHAT | 63.38 |
| chr8: 116464240-116464390 | TRPS1 | 65.6 |
| chr12: 63462800-63462950 | AVPR1A | 68.99 |
| chr5: 121492520-121492670 | LOX | 70.58 |
| chr11: 101733220-101733370 | KIAA1377 | 71.72 |
| chr13: 98011740-98011890 | MBNL2 | 73.66 |