SOM cluster: 1602
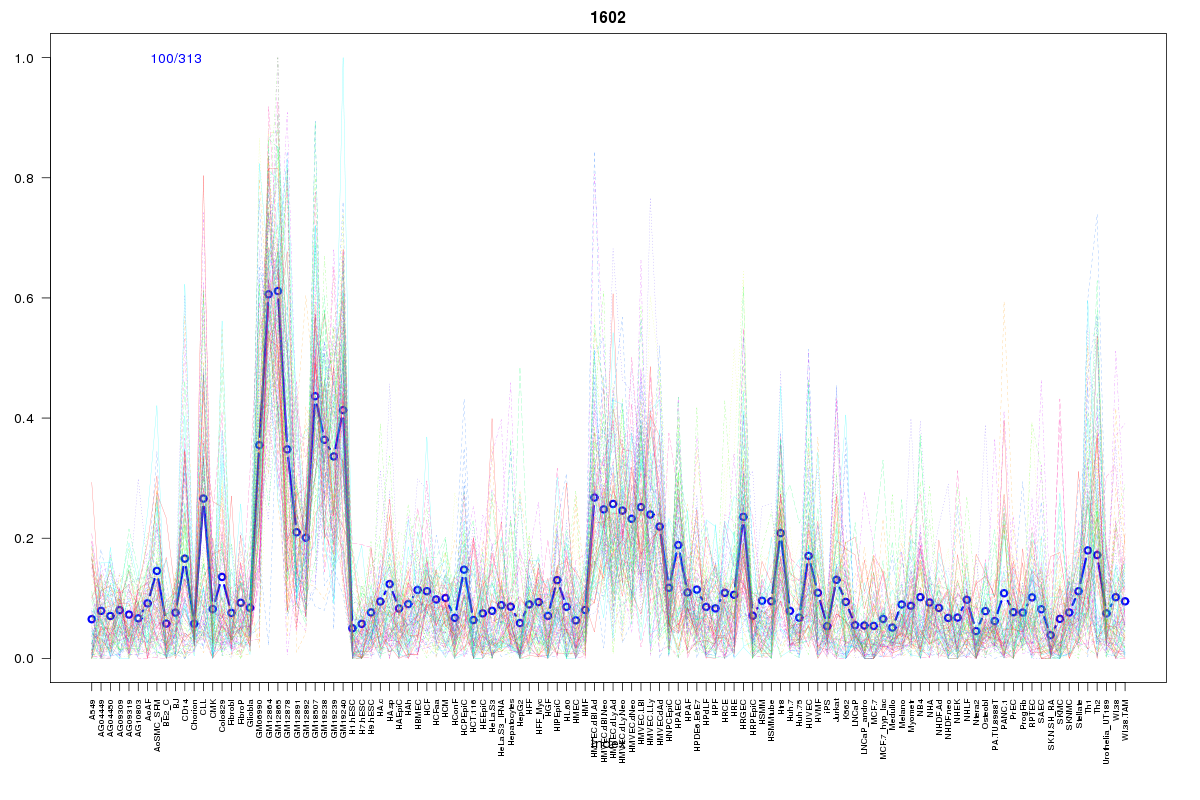
Cluster Hypersensitivity Profile

Genomic Location Trend
These plots show the distribution of the DHS sites surrounding the Transcript Start Site of the nearest gene.
Stats
Number of sites: 313Promoter: 5%
CpG-Island: 1%
Conserved: 34%
Enriched Motifs & Matches
Match Detail: [Jaspar]
|
| ||
|---|---|---|
| Sites: 37/100 | e-val: 5.2e-27 | ||
| Factor | e-val(match) | DB |
| IRF1 | 0.00000000010144 | JASPAR |
| IRF2 | 0.000000055327 | JASPAR |
| FEV | 0.00027594 | JASPAR |
| FOXO3 | 0.0052311 | JASPAR |
| NFATC2 | 0.0086561 | JASPAR |
BED file downloads
Top 10 Example Regions
| Location | Gene Link | Dist. |
|---|---|---|
| chr1: 45276180-45276330 | PTCH2 | 44.74 |
| chr4: 48833780-48833930 | FRYL | 45.9 |
| chr14: 35868225-35868495 | NFKBIA | 48.25 |
| chr11: 107896465-107896615 | RP11-144G7.2 | 52.57 |
| chr1: 9135200-9135350 | SLC2A5 | 62.48 |
| chr17: 74257840-74257990 | QRICH2 | 62.71 |
| chr13: 111856520-111856670 | ARHGEF7-IT1 | 63.67 |
| chr13: 111856520-111856670 | ARHGEF7 | 63.67 |
| chr13: 111856520-111856670 | ARHGEF7-AS1 | 63.67 |
| chr17: 2394340-2394490 | MNT | 64.69 |