SOM cluster: 1583
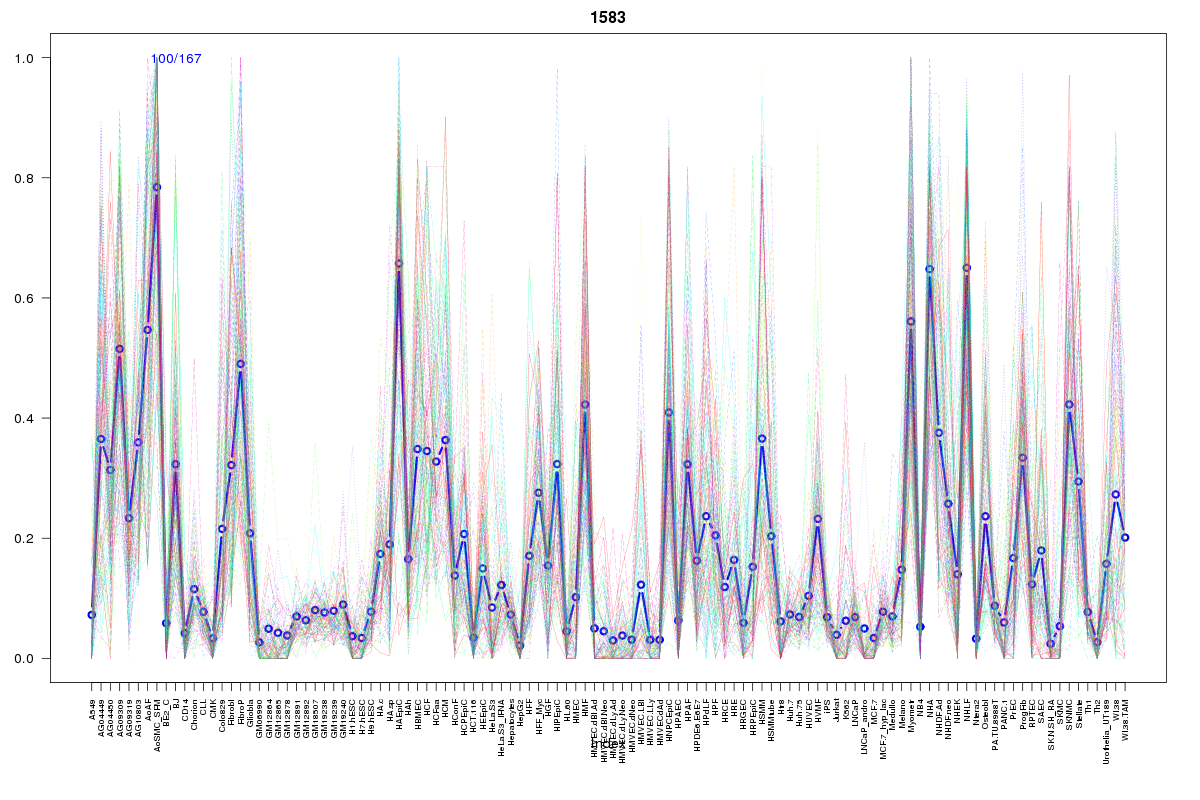
Cluster Hypersensitivity Profile

Genomic Location Trend
These plots show the distribution of the DHS sites surrounding the Transcript Start Site of the nearest gene.
Stats
Number of sites: 167Promoter: 0%
CpG-Island: 0%
Conserved: 31%
Enriched Motifs & Matches
Match Detail: [Jaspar]
|
| ||
|---|---|---|
| Sites: 35/100 | e-val: 0.00000000024 | ||
| Factor | e-val(match) | DB |
| AP1 | 0.0000016949 | JASPAR |
| NFE2L2 | 0.00048405 | JASPAR |
| PBX1 | 0.0061412 | JASPAR |
| SOX9 | 0.010136 | JASPAR |
| SRY | 0.012116 | JASPAR |
BED file downloads
Top 10 Example Regions
| Location | Gene Link | Dist. |
|---|---|---|
| chr12: 89018800-89018950 | KITLG | 48.88 |
| chr4: 178156300-178156450 | NEIL3 | 51.31 |
| chr3: 11431480-11431630 | ATG7 | 58.88 |
| chr3: 152027840-152027990 | MBNL1-AS1 | 59.94 |
| chr7: 112150300-112150450 | LSMEM1 | 64.62 |
| chr7: 112150300-112150450 | NPM1P14 | 64.62 |
| chr8: 90416100-90416250 | KRT8P4 | 65.16 |
| chr9: 72628520-72628670 | MAMDC2 | 70.56 |
| chrX: 38091680-38091830 | SRPX | 72.09 |
| chr9: 94514340-94514490 | ROR2 | 72.63 |