SOM cluster: 1567
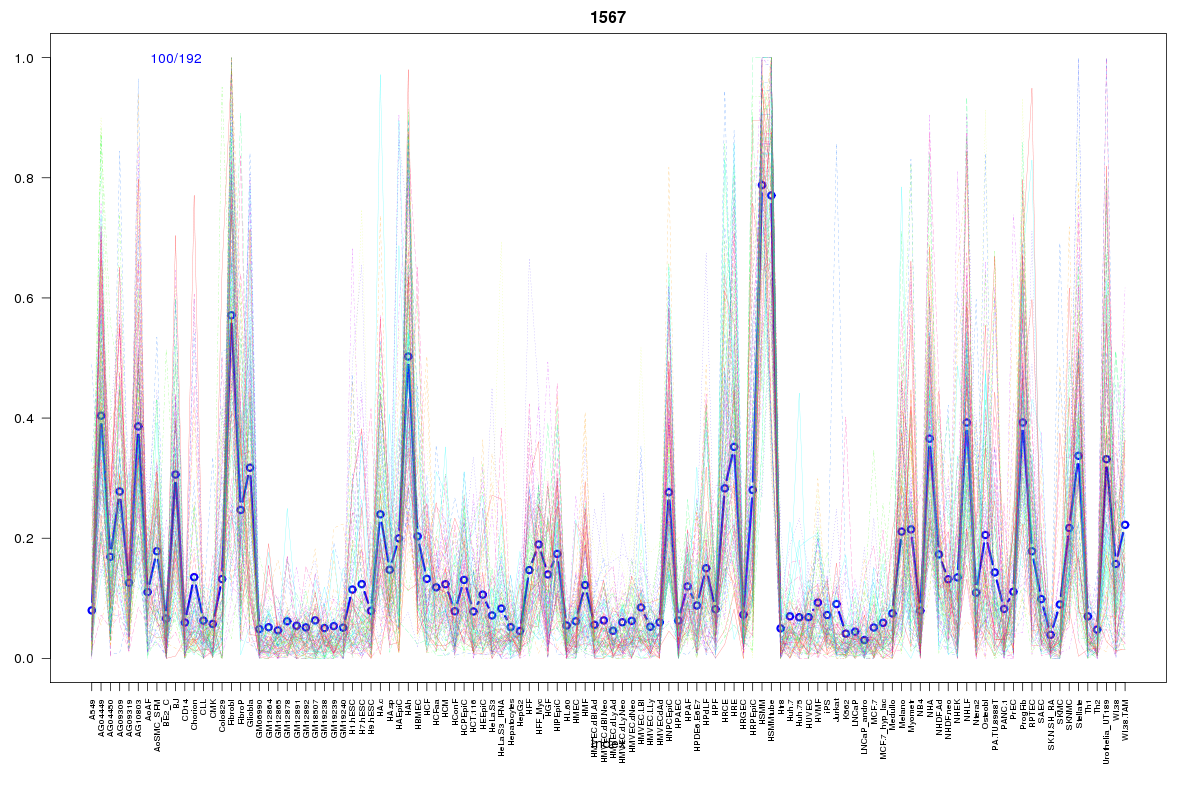
Cluster Hypersensitivity Profile

Genomic Location Trend
These plots show the distribution of the DHS sites surrounding the Transcript Start Site of the nearest gene.
Stats
Number of sites: 192Promoter: 3%
CpG-Island: 0%
Conserved: 29%
Enriched Motifs & Matches
Match Detail: [Jaspar]
|
| ||
|---|---|---|
| Sites: 47/100 | e-val: 0.00000019 | ||
| Factor | e-val(match) | DB |
| TEAD1 | 0.0000000012964 | JASPAR |
| RELA | 0.00064478 | JASPAR |
| SPI1 | 0.00071931 | JASPAR |
| NF-kappaB | 0.0028206 | JASPAR |
| SPIB | 0.0029486 | JASPAR |
BED file downloads
Top 10 Example Regions
| Location | Gene Link | Dist. |
|---|---|---|
| chr1: 150508300-150508450 | ECM1 | 18.96 |
| chr1: 150508300-150508450 | ADAMTSL4 | 18.96 |
| chr3: 124801280-124801430 | HEG1 | 42.93 |
| chr1: 47875205-47875355 | STIL | 43.19 |
| chr1: 47875205-47875355 | RP11-511I2.2 | 43.19 |
| chr3: 132502140-132502290 | NPHP3 | 47.09 |
| chr3: 132502140-132502290 | NPHP3-AS1 | 47.09 |
| chr6: 17418640-17418790 | CAP2 | 47.18 |
| chr8: 124046340-124046490 | TBC1D31 | 51.45 |
| chr1: 230880200-230880350 | C1orf198 | 53.64 |