SOM cluster: 1559
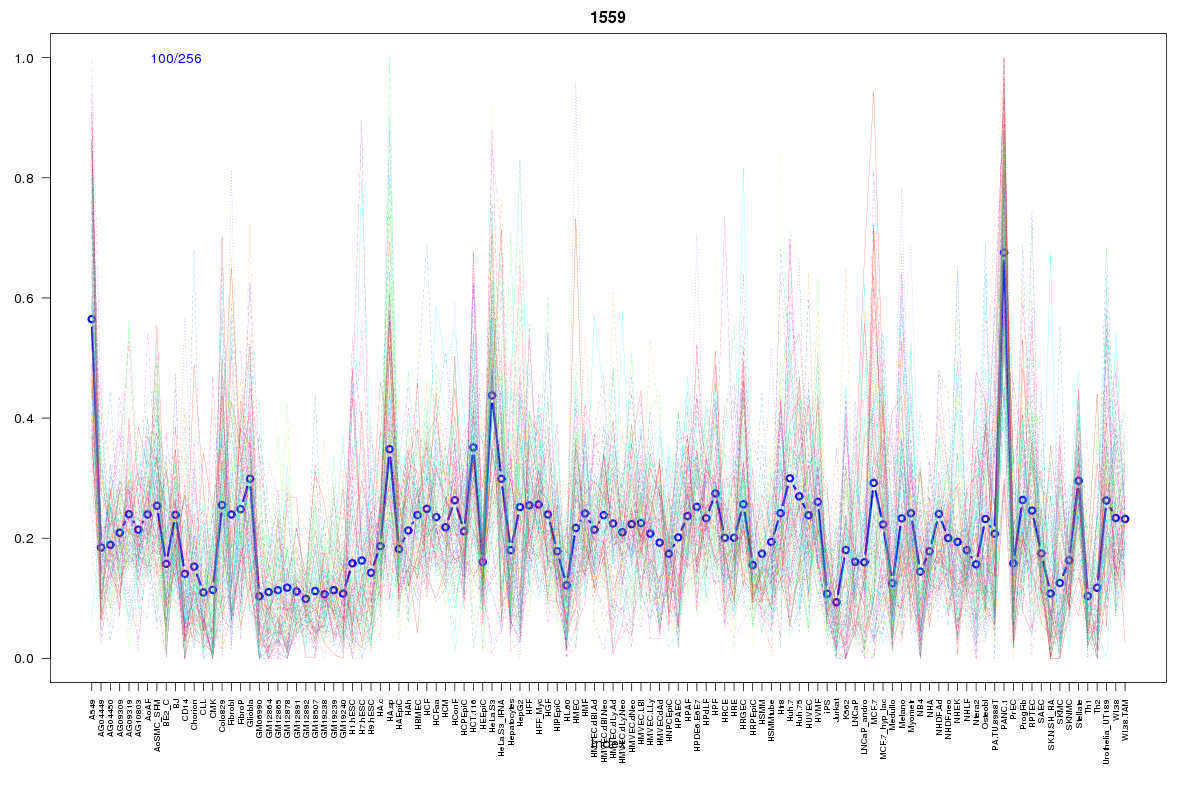
Cluster Hypersensitivity Profile

Genomic Location Trend
These plots show the distribution of the DHS sites surrounding the Transcript Start Site of the nearest gene.
Stats
Number of sites: 256Promoter: 34%
CpG-Island: 10%
Conserved: 34%
Enriched Motifs & Matches
No motifs found.BED file downloads
Top 10 Example Regions
| Location | Gene Link | Dist. |
|---|---|---|
| chr1: 149860560-149860710 | FCGR1A | 13.07 |
| chr1: 149908780-149908930 | OTUD7B | 24.23 |
| chr1: 149908780-149908930 | MTMR11 | 24.23 |
| chr7: 65730700-65730850 | RNU6-313P | 53.43 |
| chr9: 133811625-133811775 | FIBCD1 | 54.61 |
| chr3: 160295500-160295650 | KPNA4 | 55.08 |
| chr2: 138722040-138722190 | HNMT | 56.66 |
| chr2: 138722040-138722190 | AC020601.1 | 56.66 |
| chr2: 235890525-235890675 | SH3BP4 | 61.83 |
| chr9: 133565820-133565970 | PRDM12 | 62.35 |