SOM cluster: 1555
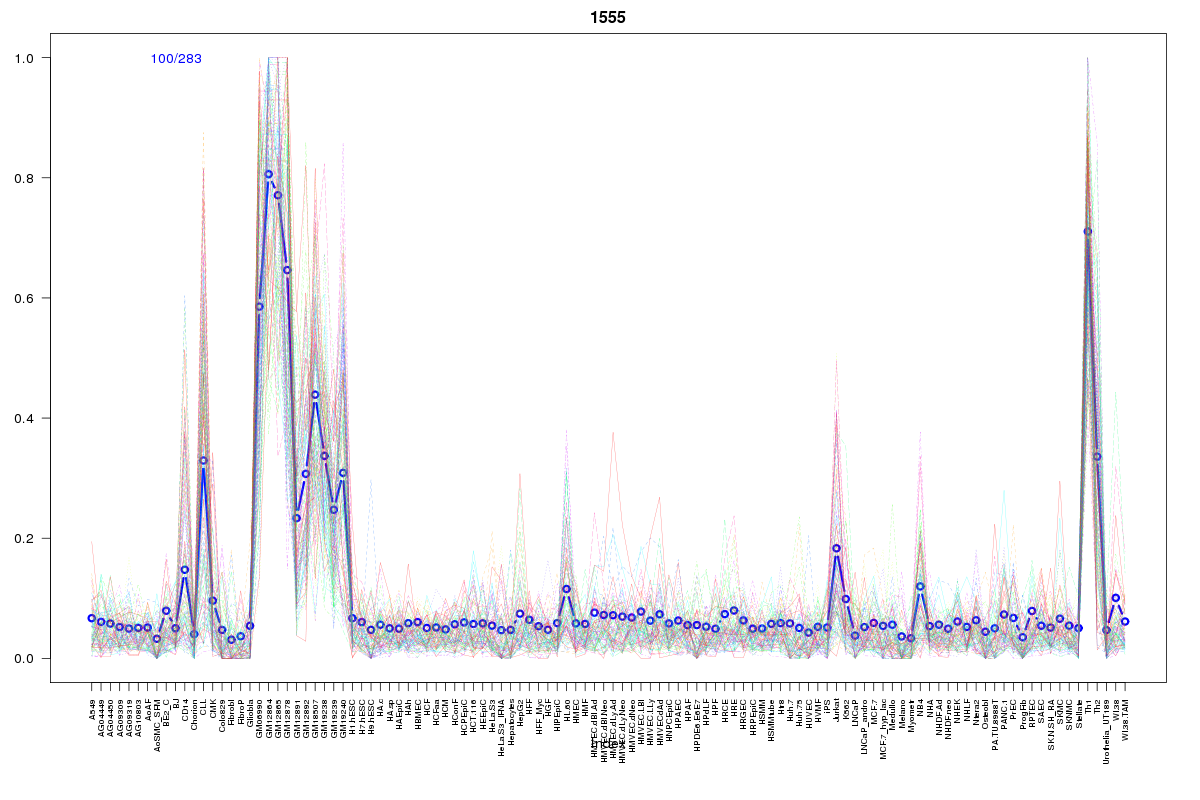
Cluster Hypersensitivity Profile

Genomic Location Trend
These plots show the distribution of the DHS sites surrounding the Transcript Start Site of the nearest gene.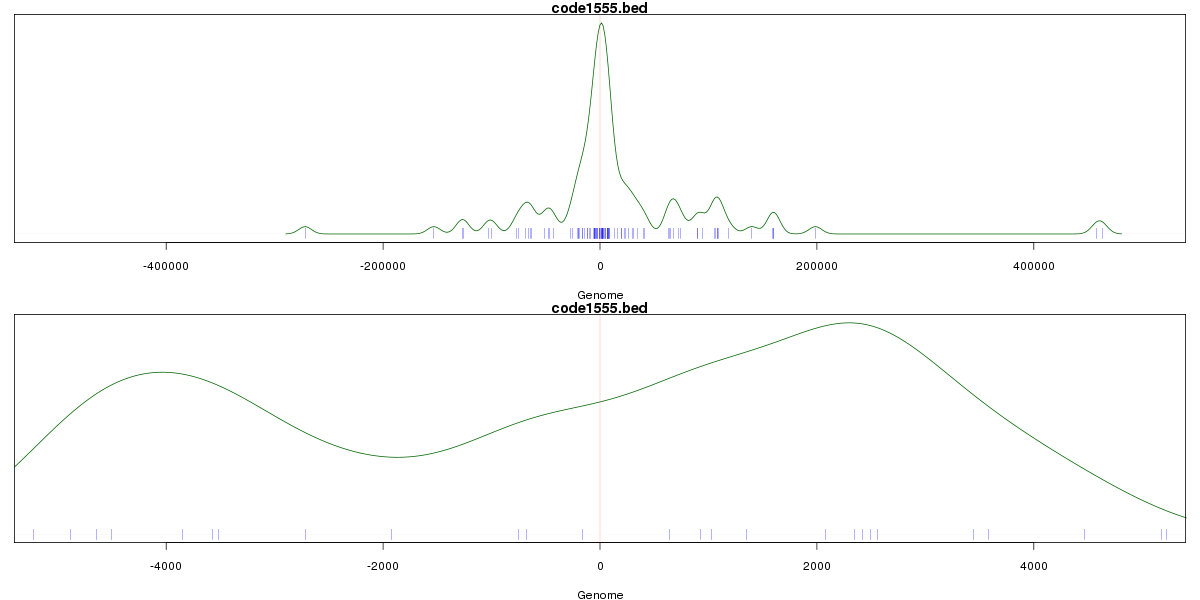
Stats
Number of sites: 283Promoter: 5%
CpG-Island: 0%
Conserved: 41%
Enriched Motifs & Matches
Match Detail: [Jaspar]
|
| ||
|---|---|---|
| Sites: 30/100 | e-val: 0.0022 | ||
| Factor | e-val(match) | DB |
| RELA | 0.0000000000000025535 | JASPAR |
| REL | 0.00000000000045319 | JASPAR |
| NFKB1 | 0.0000000000026107 | JASPAR |
| NF-kappaB | 0.0000000000061374 | JASPAR |
| FEV | 0.00072154 | JASPAR |
BED file downloads
Top 10 Example Regions
| Location | Gene Link | Dist. |
|---|---|---|
| chr9: 130667500-130667650 | RP11-203J24.8 | 43.64 |
| chr9: 130667500-130667650 | RP11-203J24.9 | 43.64 |
| chr9: 130667500-130667650 | AK1 | 43.64 |
| chr9: 130667500-130667650 | PIP5KL1 | 43.64 |
| chr6: 394085-394235 | DUSP22 | 47.84 |
| chr6: 394085-394235 | IRF4 | 47.84 |
| chr3: 16416260-16416410 | RFTN1 | 47.88 |
| chr16: 30193940-30194090 | CORO1A | 51.31 |
| chr16: 30193940-30194090 | GDPD3 | 51.31 |
| chr16: 30193940-30194090 | PPP4C | 51.31 |