SOM cluster: 1550
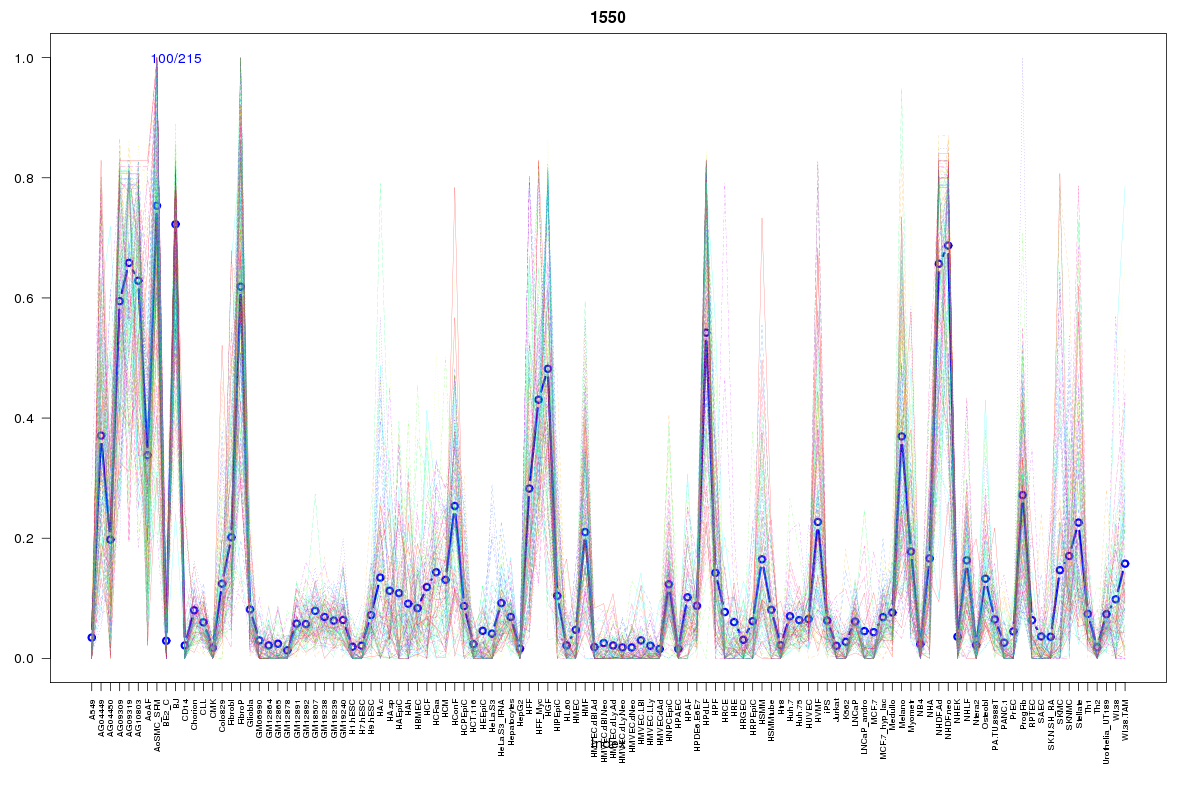
Cluster Hypersensitivity Profile

Genomic Location Trend
These plots show the distribution of the DHS sites surrounding the Transcript Start Site of the nearest gene.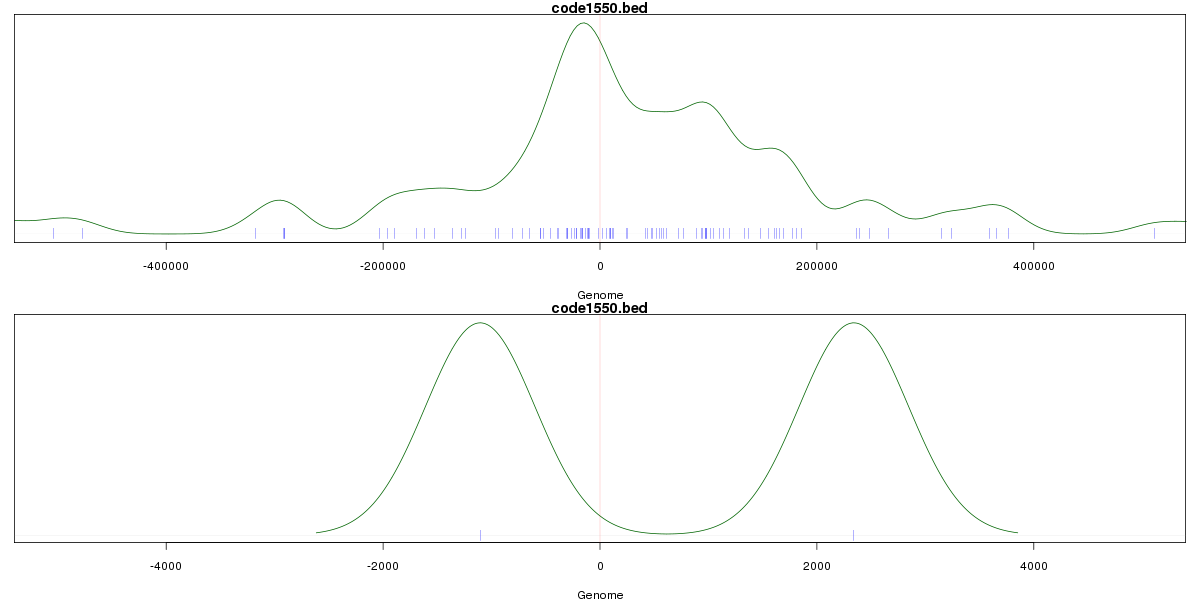
Stats
Number of sites: 215Promoter: 1%
CpG-Island: 0%
Conserved: 63%
Enriched Motifs & Matches
Match Detail: [Jaspar]
|
| ||
|---|---|---|
| Sites: 72/100 | e-val: 1e-32 | ||
| Factor | e-val(match) | DB |
| ARID3A | 0.000019338 | JASPAR |
| Foxd3 | 0.00062916 | JASPAR |
| Prrx2 | 0.00069336 | JASPAR |
| FOXA1 | 0.002705 | JASPAR |
| Lhx3 | 0.0028076 | JASPAR |
BED file downloads
Top 10 Example Regions
| Location | Gene Link | Dist. |
|---|---|---|
| chr1: 82130180-82130330 | ST13P20 | 38.96 |
| chr3: 136231360-136231510 | STAG1 | 50.03 |
| chr14: 52288680-52288830 | RNU6-301P | 58.26 |
| chr3: 142960380-142960530 | SLC9A9 | 65.05 |
| chr2: 162882045-162882195 | DPP4 | 65.52 |
| chr16: 17459940-17460090 | XYLT1 | 67.17 |
| chr9: 94954120-94954270 | IARS | 68.64 |
| chr4: 178103440-178103590 | RN7SKP136 | 69.38 |
| chr6: 54164480-54164630 | MLIP | 72.13 |
| chr6: 75839000-75839150 | COL12A1 | 74.81 |