SOM cluster: 155
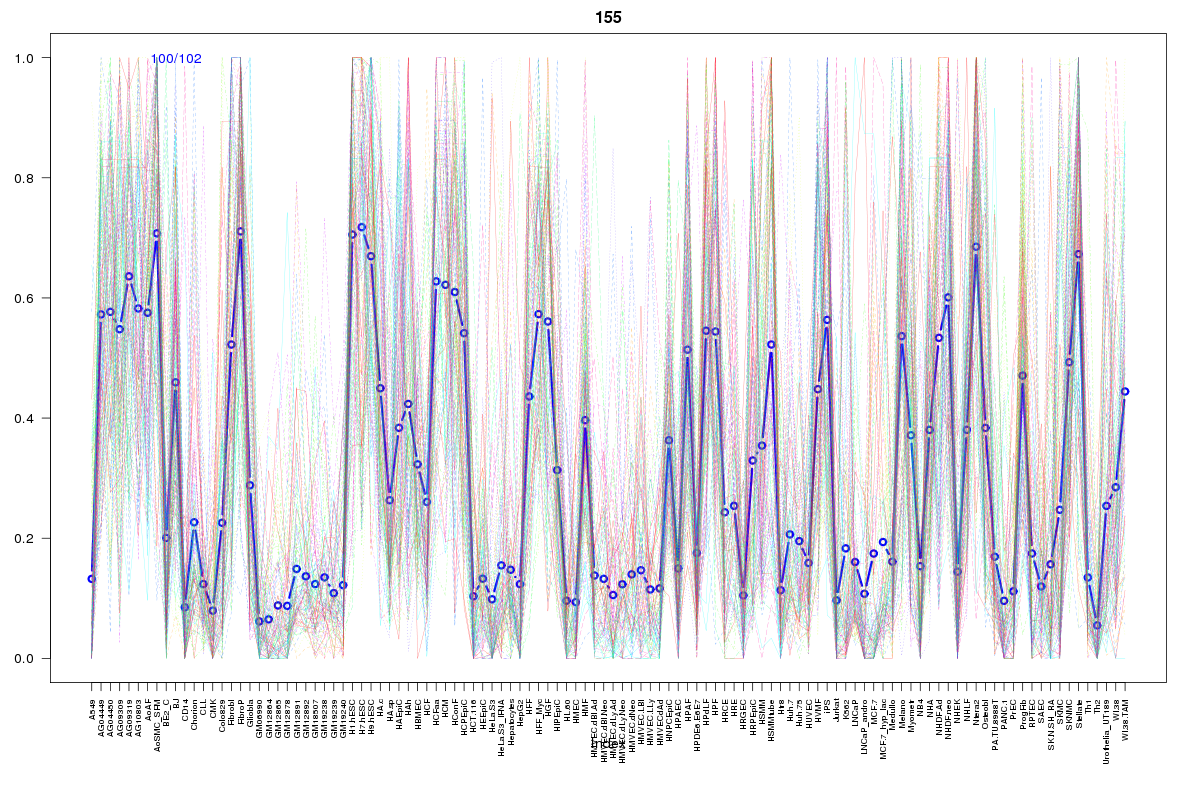
Cluster Hypersensitivity Profile

Genomic Location Trend
These plots show the distribution of the DHS sites surrounding the Transcript Start Site of the nearest gene.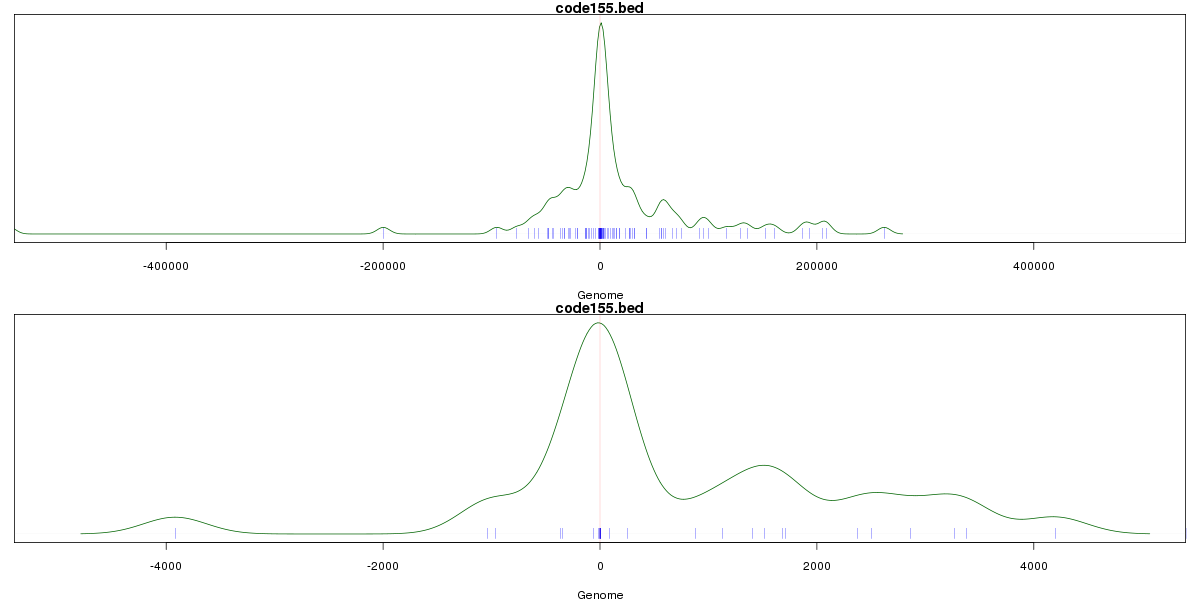
Stats
Number of sites: 102Promoter: 14%
CpG-Island: 12%
Conserved: 61%
Enriched Motifs & Matches
Match Detail: [Jaspar]
|
| ||
|---|---|---|
| Sites: 45/100 | e-val: 1.2e-30 | ||
| Factor | e-val(match) | DB |
| SP1 | 0.0000000049193 | JASPAR |
| Pax4 | 0.000016586 | JASPAR |
| RREB1 | 0.00022262 | JASPAR |
| EWSR1-FLI1 | 0.0023811 | JASPAR |
| MZF1_1-4 | 0.0024567 | JASPAR |
|
| ||
| Sites: 45/100 | e-val: 0.0000002 | ||
| Factor | e-val(match) | DB |
| EWSR1-FLI1 | 0.000066693 | JASPAR |
| TLX1::NFIC | 0.0019766 | JASPAR |
| Spz1 | 0.0047953 | JASPAR |
| SPI1 | 0.023043 | JASPAR |
| AP1 | 0.033106 | JASPAR |
|
| ||
| Sites: 23/100 | e-val: 0.0062 | ||
| Factor | e-val(match) | DB |
| Myf | 0.00025745 | JASPAR |
| NHLH1 | 0.0018398 | JASPAR |
| SP1 | 0.0040388 | JASPAR |
| SPIB | 0.0068106 | JASPAR |
| REST | 0.013965 | JASPAR |
BED file downloads
Top 10 Example Regions
| Location | Gene Link | Dist. |
|---|---|---|
| chr11: 14408620-14408770 | RRAS2 | 43.5 |
| chr2: 97573260-97573410 | CNNM3 | 55.4 |
| chr2: 97573260-97573410 | ANKRD39 | 55.4 |
| chr2: 97573260-97573410 | CNNM4 | 55.4 |
| chr19: 13829700-13829850 | MRI1 | 57.28 |
| chr8: 52721980-52722130 | AC090186.1 | 59.03 |
| chr8: 52721980-52722130 | RP11-11C20.1 | 59.03 |
| chr12: 112074180-112074330 | BRAP | 62.04 |
| chr12: 112074180-112074330 | PCNPP1 | 62.04 |
| chr10: 30725240-30725390 | MAP3K8 | 66.81 |