SOM cluster: 1537
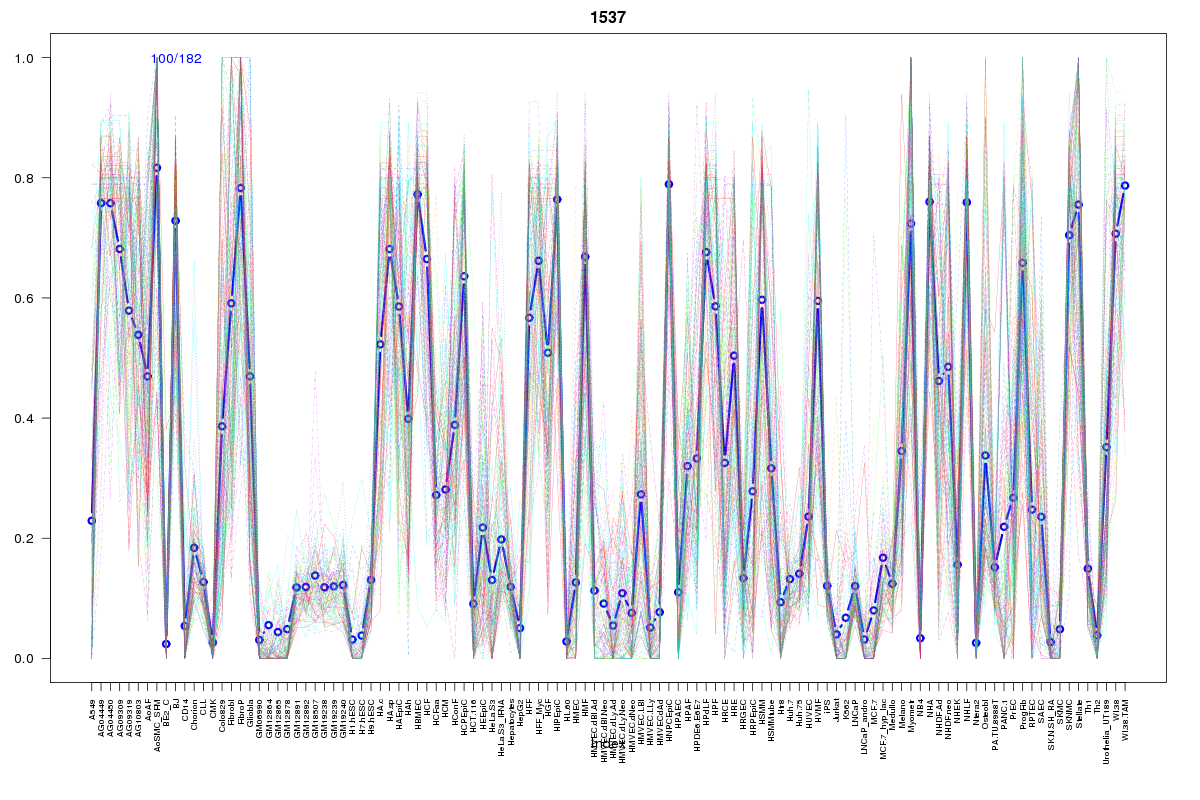
Cluster Hypersensitivity Profile

Genomic Location Trend
These plots show the distribution of the DHS sites surrounding the Transcript Start Site of the nearest gene.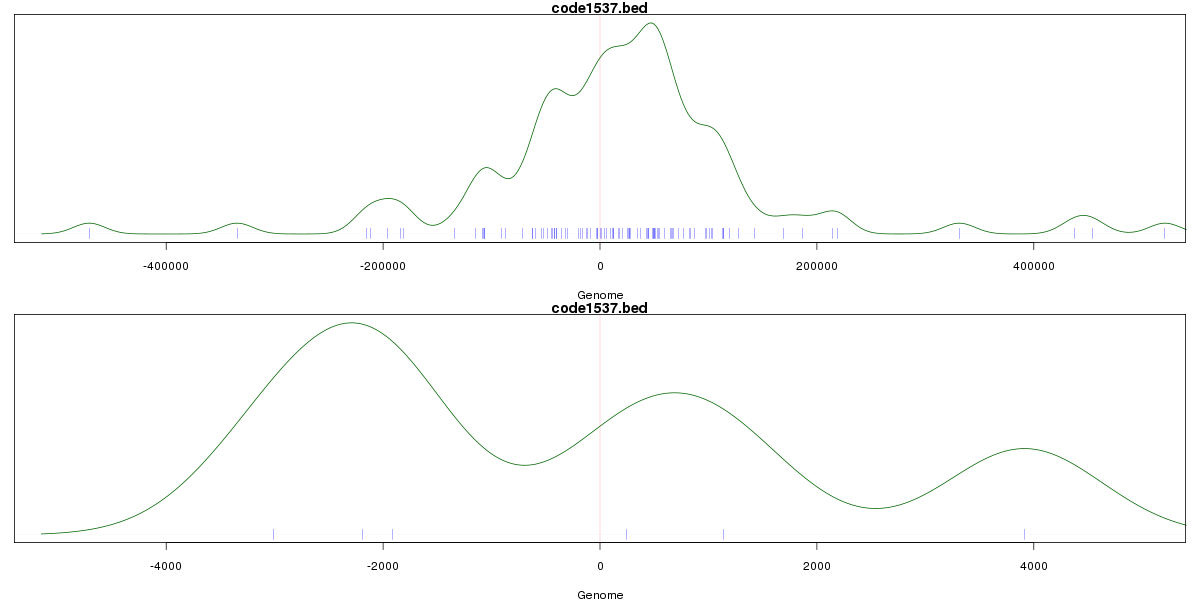
Stats
Number of sites: 182Promoter: 1%
CpG-Island: 0%
Conserved: 28%
Enriched Motifs & Matches
Match Detail: [Jaspar]
|
| ||
|---|---|---|
| Sites: 25/100 | e-val: 1.6 | ||
| Factor | e-val(match) | DB |
| MEF2A | 0.0036647 | JASPAR |
| ARID3A | 0.0074311 | JASPAR |
| FOXF2 | 0.01871 | JASPAR |
| AP1 | 0.033103 | JASPAR |
| Foxd3 | 0.037455 | JASPAR |
BED file downloads
Top 10 Example Regions
| Location | Gene Link | Dist. |
|---|---|---|
| chr1: 146763840-146763990 | CHD1L | 14.01 |
| chr1: 146763840-146763990 | FMO5 | 14.01 |
| chr1: 146763840-146763990 | CCT8P1 | 14.01 |
| chr15: 96828600-96828750 | RP11-522B15.3 | 35.5 |
| chr15: 96828600-96828750 | NR2F2 | 35.5 |
| chr1: 214568040-214568190 | PTPN14 | 45.62 |
| chr11: 62199140-62199290 | ASRGL1 | 54.28 |
| chr11: 62199140-62199290 | AHNAK | 54.28 |
| chr1: 183013500-183013650 | LAMC1 | 57 |
| chr7: 55198480-55198630 | EGFR | 57.93 |