SOM cluster: 1527
Cluster Hypersensitivity Profile

Genomic Location Trend
These plots show the distribution of the DHS sites surrounding the Transcript Start Site of the nearest gene.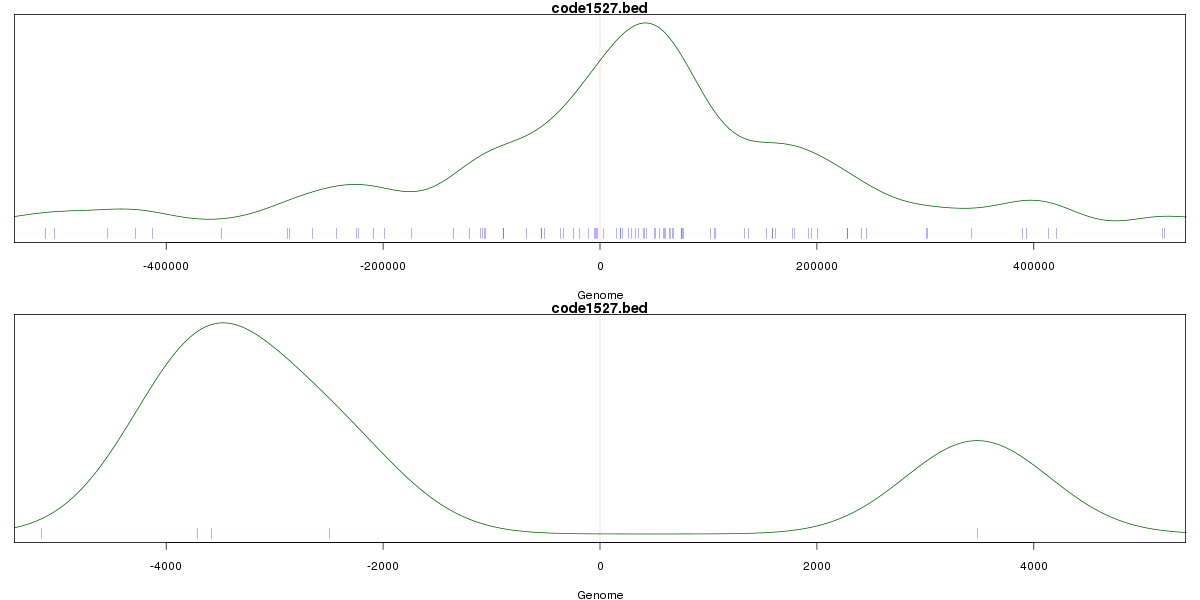
Stats
Number of sites: 1915Promoter: 0%
CpG-Island: 0%
Conserved: 31%
Enriched Motifs & Matches
No motifs found.BED file downloads
Top 10 Example Regions
| Location | Gene Link | Dist. |
|---|---|---|
| chr2: 75361400-75361550 | TACR1 | 43.81 |
| chr3: 156335640-156335790 | TIPARP | 44.93 |
| chr15: 82460760-82460910 | EFTUD1 | 46.93 |
| chr11: 19388425-19388575 | NAV2-IT1 | 53.07 |
| chr12: 70787760-70787910 | CNOT2 | 53.72 |
| chr1: 216078985-216079135 | RP5-1111A8.3 | 54.14 |
| chr9: 97670620-97670770 | RP11-49O14.2 | 54.6 |
| chr5: 129504060-129504210 | HSPA8P4 | 56.86 |
| chr5: 129504060-129504210 | CHSY3 | 56.86 |
| chr4: 38986100-38986250 | KLHL5 | 58.35 |