SOM cluster: 1526
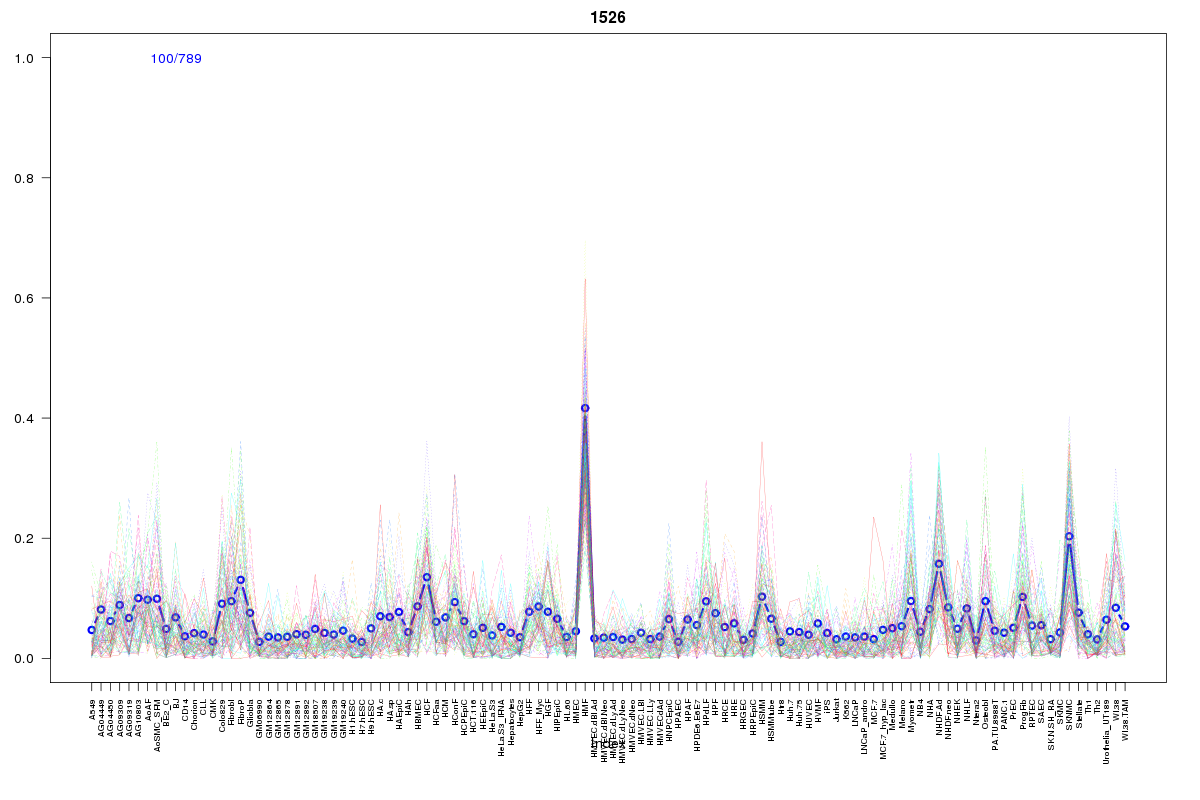
Cluster Hypersensitivity Profile

Genomic Location Trend
These plots show the distribution of the DHS sites surrounding the Transcript Start Site of the nearest gene.
Stats
Number of sites: 789Promoter: 1%
CpG-Island: 0%
Conserved: 28%
Enriched Motifs & Matches
Match Detail: [Jaspar]
|
| ||
|---|---|---|
| Sites: 35/100 | e-val: 0.0035 | ||
| Factor | e-val(match) | DB |
| AP1 | 0.0000000011135 | JASPAR |
| NFE2L2 | 0.000000017231 | JASPAR |
| PBX1 | 0.00021922 | JASPAR |
| NFE2L1::MafG | 0.0014014 | JASPAR |
| Pax6 | 0.0035862 | JASPAR |
BED file downloads
Top 10 Example Regions
| Location | Gene Link | Dist. |
|---|---|---|
| chr1: 145633900-145634050 | NUDT17 | 13.02 |
| chr1: 145633900-145634050 | RNF115 | 13.02 |
| chr16: 8712585-8712735 | METTL22 | 39.91 |
| chr5: 130417900-130418050 | HINT1 | 45.65 |
| chr12: 100311920-100312070 | ANKS1B | 47.1 |
| chr1: 201161760-201161910 | RP11-567E21.3 | 52.42 |
| chr13: 44970300-44970450 | SERP2 | 53.47 |
| chr12: 121008820-121008970 | DYNLL1 | 56.22 |
| chr12: 121008820-121008970 | RPL11P5 | 56.22 |
| chr3: 141067820-141067970 | RP11-438D8.2 | 58.36 |