SOM cluster: 1523
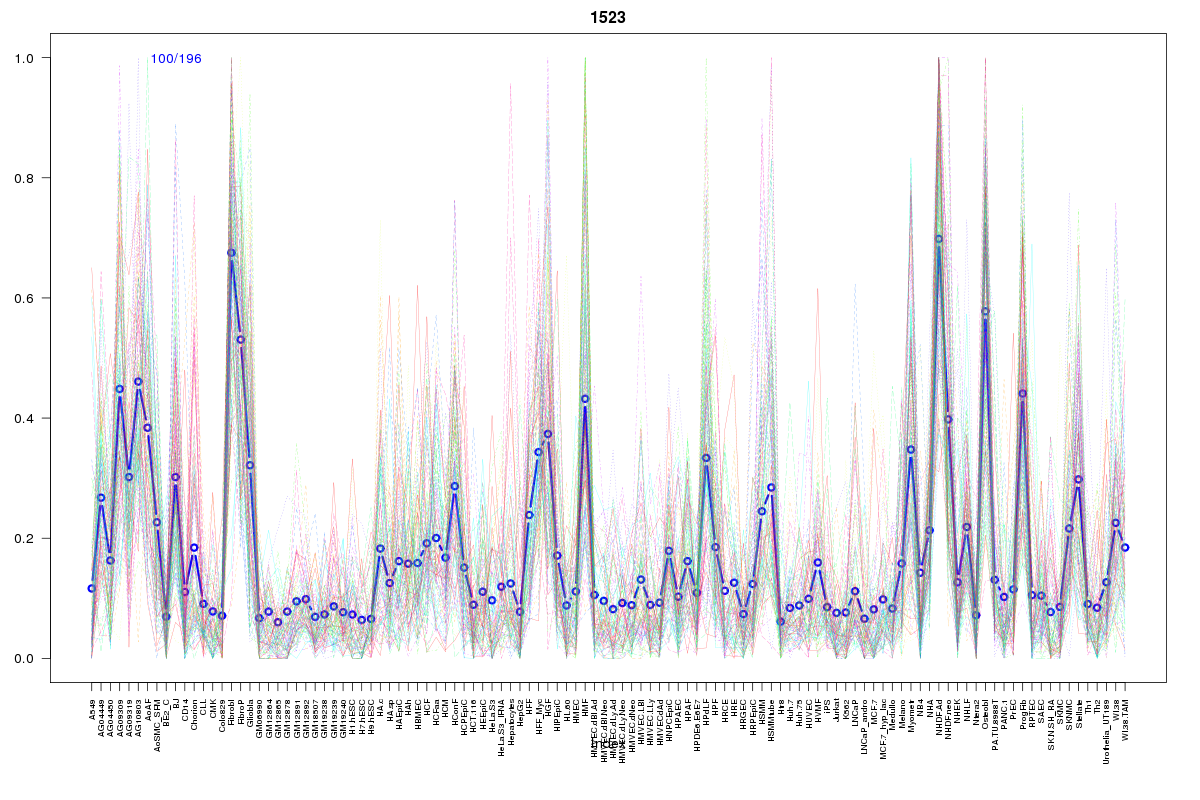
Cluster Hypersensitivity Profile

Genomic Location Trend
These plots show the distribution of the DHS sites surrounding the Transcript Start Site of the nearest gene.
Stats
Number of sites: 196Promoter: 4%
CpG-Island: 0%
Conserved: 27%
Enriched Motifs & Matches
Match Detail: [Jaspar]
|
| ||
|---|---|---|
| Sites: 44/100 | e-val: 0.000000000014 | ||
| Factor | e-val(match) | DB |
| SP1 | 0.00000046628 | JASPAR |
| Klf4 | 0.0000052649 | JASPAR |
| RREB1 | 0.000022693 | JASPAR |
| Pax4 | 0.0015221 | JASPAR |
| Egr1 | 0.0070451 | JASPAR |
|
| ||
| Sites: 36/100 | e-val: 0.000000056 | ||
| Factor | e-val(match) | DB |
| AP1 | 0.000000001426 | JASPAR |
| NFE2L2 | 0.00000091861 | JASPAR |
| NFE2L1::MafG | 0.013197 | JASPAR |
| Foxa2 | 0.049144 | JASPAR |
| PPARG | 0.053559 | JASPAR |
BED file downloads
Top 10 Example Regions
| Location | Gene Link | Dist. |
|---|---|---|
| chr19: 33674940-33675090 | LRP3 | 43.19 |
| chr4: 1028060-1028210 | IDUA | 50.33 |
| chr4: 1028060-1028210 | SNORA48 | 50.33 |
| chr11: 6519500-6519650 | TRIM3 | 52.41 |
| chr11: 6519500-6519650 | APBB1 | 52.41 |
| chr2: 128419540-128419690 | GPR17 | 55.77 |
| chr2: 128419540-128419690 | SFT2D3 | 55.77 |
| chr2: 128419540-128419690 | LIMS2 | 55.77 |
| chr2: 128419540-128419690 | WDR33 | 55.77 |
| chr14: 23830700-23830850 | PABPN1 | 57.98 |