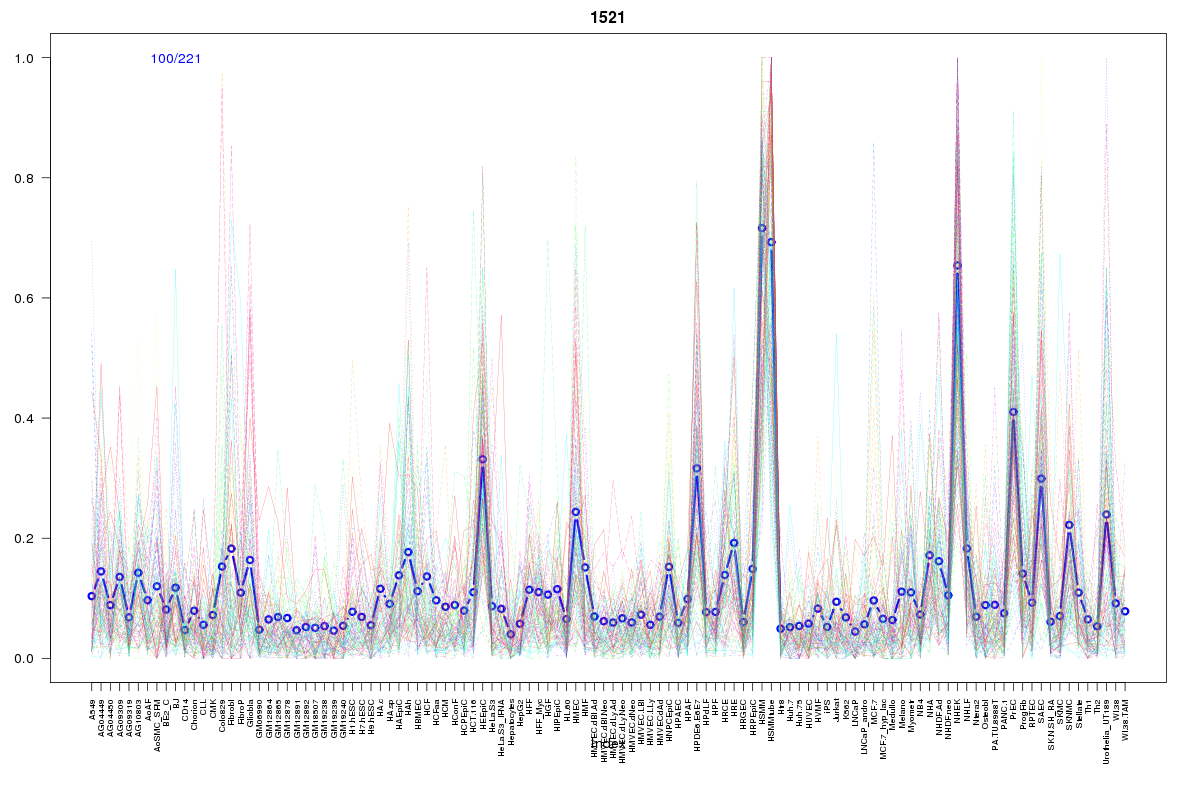
SOM cluster: 1521
Cluster Hypersensitivity Profile

Genomic Location Trend
These plots show the distribution of the DHS sites surrounding the Transcript Start Site of the nearest gene.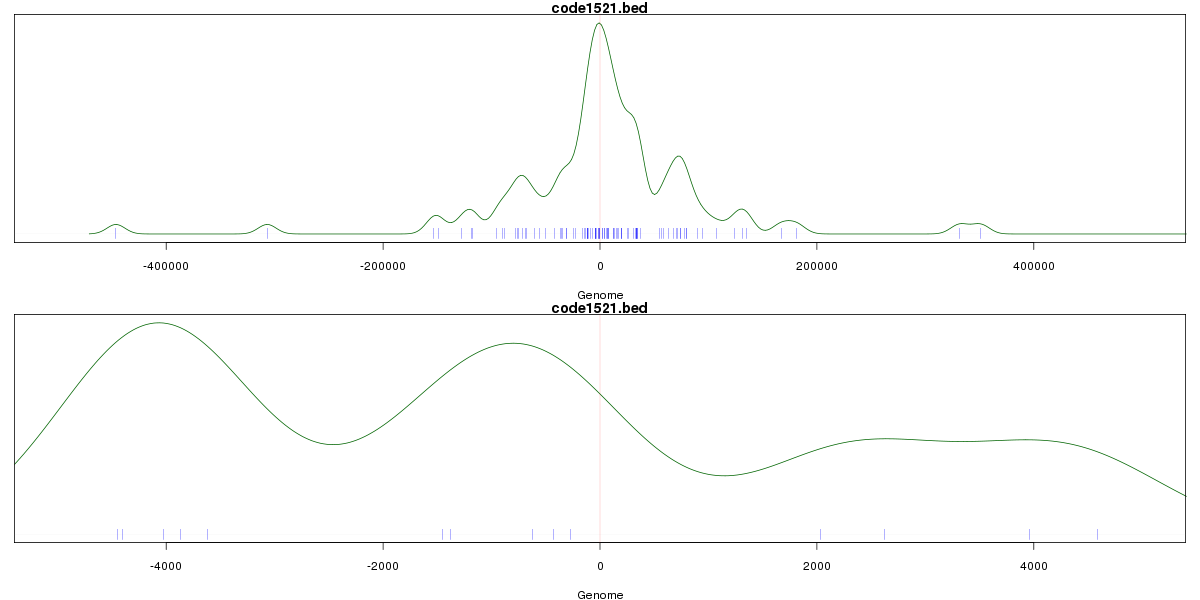
Stats
Number of sites: 221Promoter: 5%
CpG-Island: 0%
Conserved: 39%
Enriched Motifs & Matches
Match Detail: [Jaspar]
|
| ||
|---|---|---|
| Sites: 23/100 | e-val: 0.000083 | ||
| Factor | e-val(match) | DB |
| Myf | 0.00015979 | JASPAR |
| Myb | 0.0010392 | JASPAR |
| Spz1 | 0.0031756 | JASPAR |
| TAL1::TCF3 | 0.0060372 | JASPAR |
| NHLH1 | 0.006964 | JASPAR |
BED file downloads
Top 10 Example Regions
| Location | Gene Link | Dist. |
|---|---|---|
| chr1: 147233140-147233290 | RP11-433J22.2 | 47.69 |
| chr11: 11630340-11630490 | RP11-483L5.1 | 54.68 |
| chr4: 54944040-54944190 | CHIC2 | 54.96 |
| chr4: 54944040-54944190 | RPL21P44 | 54.96 |
| chr13: 109924640-109924790 | LINC00370 | 60.69 |
| chr12: 116758840-116758990 | MED13L | 61.67 |
| chr15: 92920420-92920570 | ST8SIA2 | 70.1 |
| chr1: 8135660-8135810 | ERRFI1 | 71.39 |
| chr1: 8135660-8135810 | CTA-215D11.4 | 71.39 |
| chr6: 3823480-3823630 | RP1-140K8.3 | 77.37 |