SOM cluster: 1511
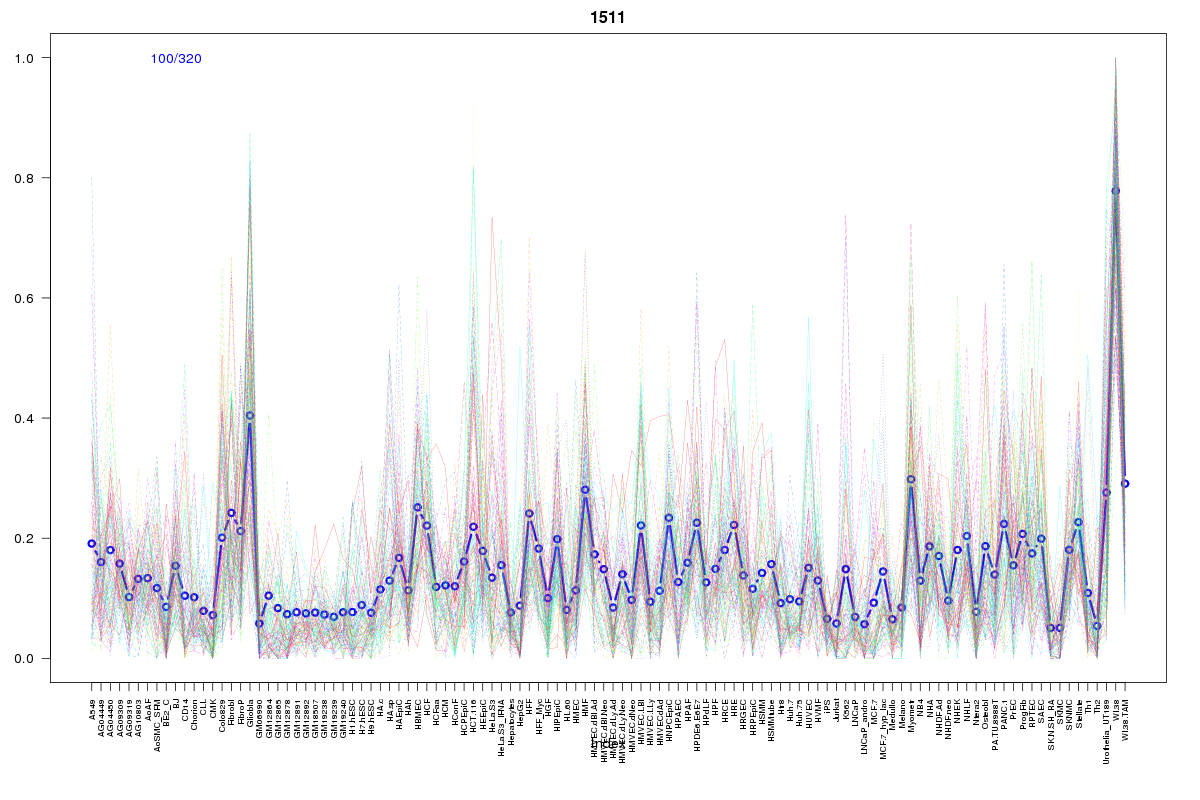
Cluster Hypersensitivity Profile

Genomic Location Trend
These plots show the distribution of the DHS sites surrounding the Transcript Start Site of the nearest gene.
Stats
Number of sites: 320Promoter: 4%
CpG-Island: 0%
Conserved: 21%
Enriched Motifs & Matches
Match Detail: [Jaspar]
|
| ||
|---|---|---|
| Sites: 36/100 | e-val: 0.000000000051 | ||
| Factor | e-val(match) | DB |
| AP1 | 0.0000000021505 | JASPAR |
| NFE2L2 | 0.00000002235 | JASPAR |
| Pax2 | 0.0033855 | JASPAR |
| PPARG | 0.0055911 | JASPAR |
| NFE2L1::MafG | 0.0096756 | JASPAR |
BED file downloads
Top 10 Example Regions
| Location | Gene Link | Dist. |
|---|---|---|
| chr3: 138462580-138462730 | EEF1A1P25 | 51.12 |
| chr9: 117568320-117568470 | TNFSF15 | 53.63 |
| chr12: 28019760-28019910 | KLHL42 | 53.68 |
| chr17: 70822800-70822950 | SLC39A11 | 53.73 |
| chr9: 112885780-112885930 | AKAP2 | 57.12 |
| chr10: 97067520-97067670 | C10orf129 | 57.35 |
| chr8: 21958940-21959090 | BMP1 | 57.46 |
| chr8: 19435840-19435990 | CSGALNACT1 | 58.03 |
| chr12: 45737180-45737330 | ANO6 | 58.31 |
| chr17: 76305100-76305250 | SOCS3 | 58.58 |