SOM cluster: 1510
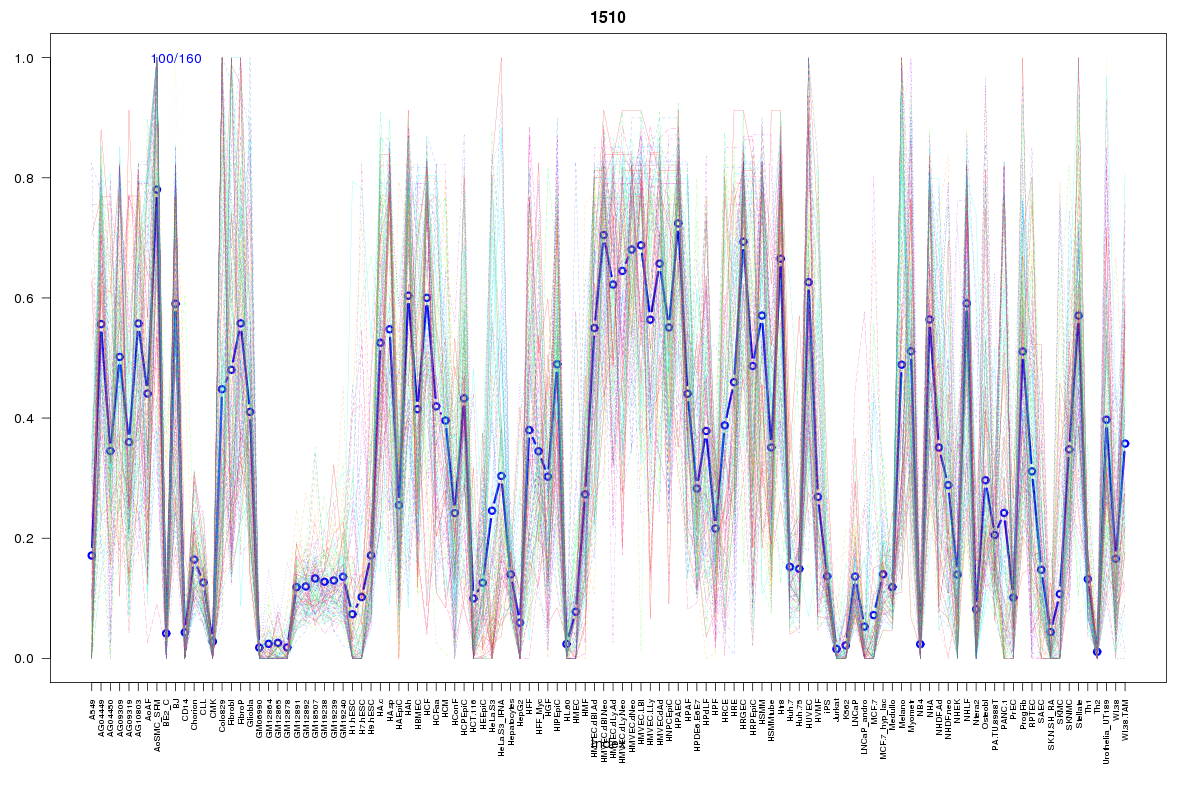
Cluster Hypersensitivity Profile

Genomic Location Trend
These plots show the distribution of the DHS sites surrounding the Transcript Start Site of the nearest gene.
Stats
Number of sites: 160Promoter: 2%
CpG-Island: 0%
Conserved: 66%
Enriched Motifs & Matches
Match Detail: [Jaspar]
|
| ||
|---|---|---|
| Sites: 56/100 | e-val: 3.7e-19 | ||
| Factor | e-val(match) | DB |
| FOXA1 | 0.004371 | JASPAR |
| FOXO3 | 0.0076702 | JASPAR |
| Pou5f1 | 0.0080638 | JASPAR |
| Foxa2 | 0.01003 | JASPAR |
| TEAD1 | 0.012392 | JASPAR |
|
| ||
| Sites: 47/100 | e-val: 0.000055 | ||
| Factor | e-val(match) | DB |
| NFATC2 | 0.0000091588 | JASPAR |
| NFE2L2 | 0.000062366 | JASPAR |
| HNF1A | 0.0007079 | JASPAR |
| AP1 | 0.00097418 | JASPAR |
| Lhx3 | 0.0020645 | JASPAR |
BED file downloads
Top 10 Example Regions
| Location | Gene Link | Dist. |
|---|---|---|
| chr4: 95393360-95393510 | PDLIM5 | 42.69 |
| chr1: 219362460-219362610 | RP11-135J2.3 | 47.62 |
| chr1: 219362460-219362610 | RP11-135J2.4 | 47.62 |
| chr1: 59594520-59594670 | RP11-470E16.1 | 50.27 |
| chr2: 111829560-111829710 | ACOXL | 53.05 |
| chr4: 158037220-158037370 | GRIA2 | 56.89 |
| chr9: 18658880-18659030 | ADAMTSL1 | 58.4 |
| chr4: 159696560-159696710 | FNIP2 | 59.85 |
| chr4: 159696560-159696710 | PPID | 59.85 |
| chr7: 107580240-107580390 | LAMB1 | 60.33 |