SOM cluster: 1496
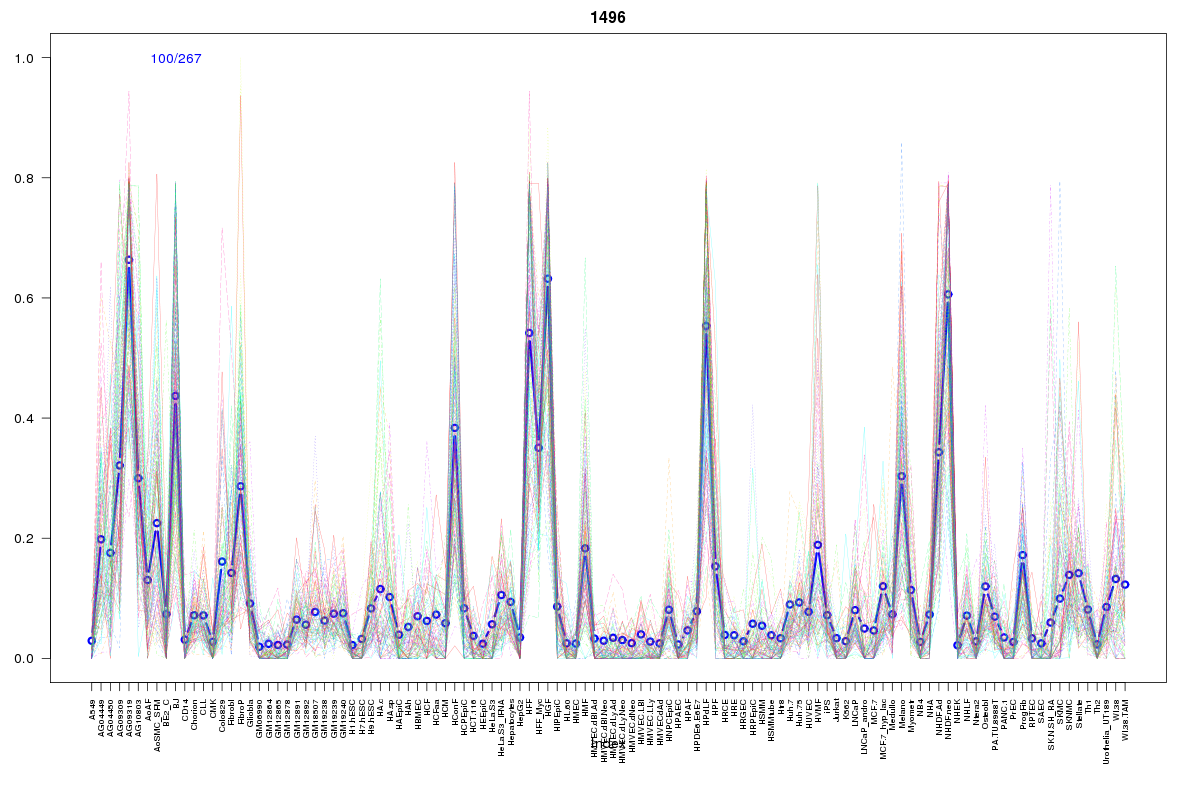
Cluster Hypersensitivity Profile

Genomic Location Trend
These plots show the distribution of the DHS sites surrounding the Transcript Start Site of the nearest gene.
Stats
Number of sites: 267Promoter: 0%
CpG-Island: 0%
Conserved: 52%
Enriched Motifs & Matches
Match Detail: [Jaspar]
|
| ||
|---|---|---|
| Sites: 53/100 | e-val: 5.60519e-45 | ||
| Factor | e-val(match) | DB |
| TAL1::TCF3 | 0.000013762 | JASPAR |
| ARID3A | 0.000023165 | JASPAR |
| Prrx2 | 0.000051106 | JASPAR |
| Nobox | 0.00032238 | JASPAR |
| HNF1A | 0.00094004 | JASPAR |
|
| ||
| Sites: 24/100 | e-val: 0.39 | ||
| Factor | e-val(match) | DB |
| MEF2A | 0.000046137 | JASPAR |
| Foxq1 | 0.0073156 | JASPAR |
| HNF1A | 0.011743 | JASPAR |
| FOXF2 | 0.016371 | JASPAR |
| Foxd3 | 0.016853 | JASPAR |
|
| ||
| Sites: 19/100 | e-val: 0.18 | ||
| Factor | e-val(match) | DB |
| IRF1 | 0.000058277 | JASPAR |
| Foxa2 | 0.00008209 | JASPAR |
| FOXO3 | 0.00050856 | JASPAR |
| FOXA1 | 0.0022866 | JASPAR |
| IRF2 | 0.0092185 | JASPAR |
BED file downloads
Top 10 Example Regions
| Location | Gene Link | Dist. |
|---|---|---|
| chrX: 150082080-150082230 | CD99L2 | 27.73 |
| chr8: 121253660-121253810 | COL14A1 | 29.28 |
| chr9: 132488105-132488255 | TOR1B | 38.26 |
| chr9: 132488105-132488255 | PRRX2 | 38.26 |
| chr3: 184084860-184085010 | ECE2 | 52.23 |
| chr5: 82729880-82730030 | VCAN | 55.33 |
| chr8: 59745720-59745870 | TOX | 55.86 |
| chr7: 150089160-150089310 | GIMAP8 | 62.38 |
| chr7: 150089160-150089310 | ACTR3C | 62.38 |
| chr1: 170195060-170195210 | METTL11B | 62.62 |