SOM cluster: 1484
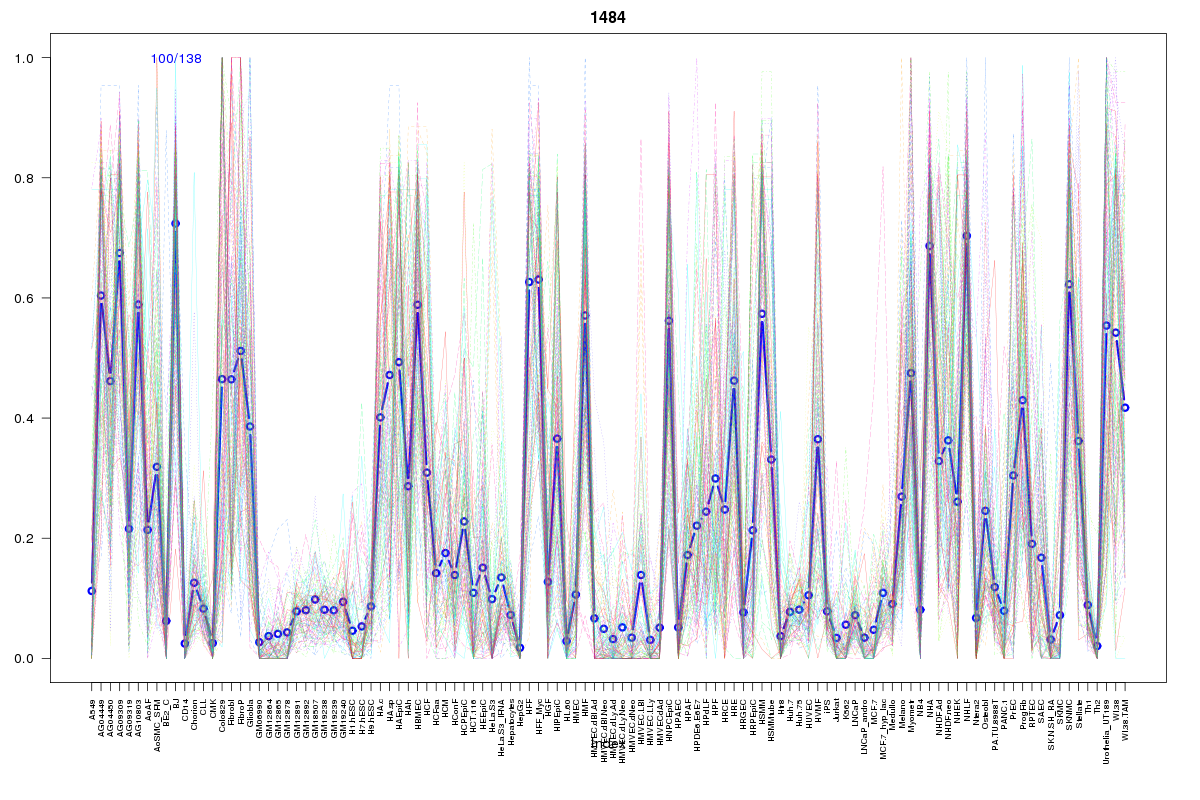
Cluster Hypersensitivity Profile

Genomic Location Trend
These plots show the distribution of the DHS sites surrounding the Transcript Start Site of the nearest gene.
Stats
Number of sites: 138Promoter: 0%
CpG-Island: 0%
Conserved: 39%
Enriched Motifs & Matches
Match Detail: [Jaspar]
|
| ||
|---|---|---|
| Sites: 19/100 | e-val: 0.00016 | ||
| Factor | e-val(match) | DB |
| CREB1 | 0.0035473 | JASPAR |
| NFE2L2 | 0.0037628 | JASPAR |
| Pax5 | 0.0039307 | JASPAR |
| NFE2L1::MafG | 0.0066939 | JASPAR |
| SPIB | 0.0096117 | JASPAR |
BED file downloads
Top 10 Example Regions
| Location | Gene Link | Dist. |
|---|---|---|
| chr12: 91503180-91503330 | DCN | 56.65 |
| chr12: 91503180-91503330 | LUM | 56.65 |
| chr11: 26799940-26800090 | SLC5A12 | 59.93 |
| chr11: 111312220-111312370 | POU2AF1 | 60.19 |
| chr11: 111312220-111312370 | LAYN | 60.19 |
| chr6: 105640740-105640890 | BVES | 65.08 |
| chr6: 105640740-105640890 | POPDC3 | 65.08 |
| chr11: 20132920-20133070 | NAV2 | 66.51 |
| chr1: 210612400-210612550 | HHAT | 69.64 |
| chr12: 5205585-5205735 | RP11-429A20.2 | 69.86 |