SOM cluster: 1480
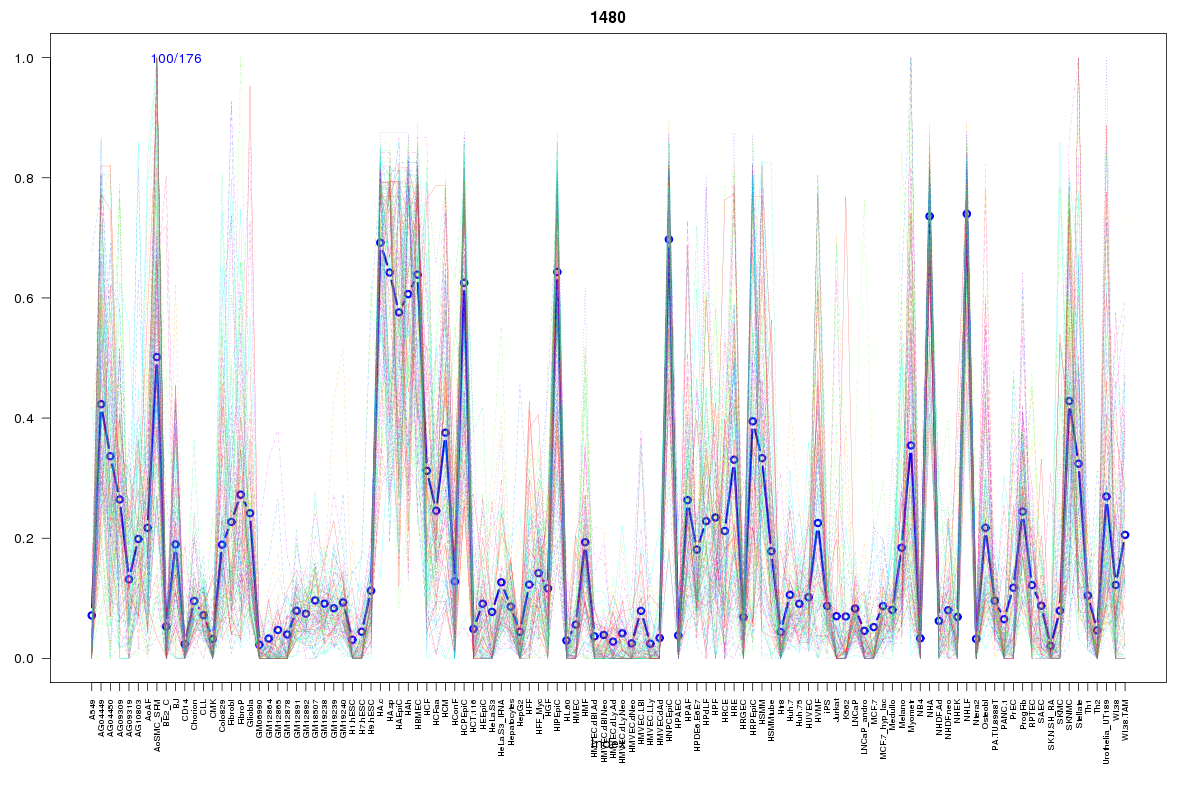
Cluster Hypersensitivity Profile

Genomic Location Trend
These plots show the distribution of the DHS sites surrounding the Transcript Start Site of the nearest gene.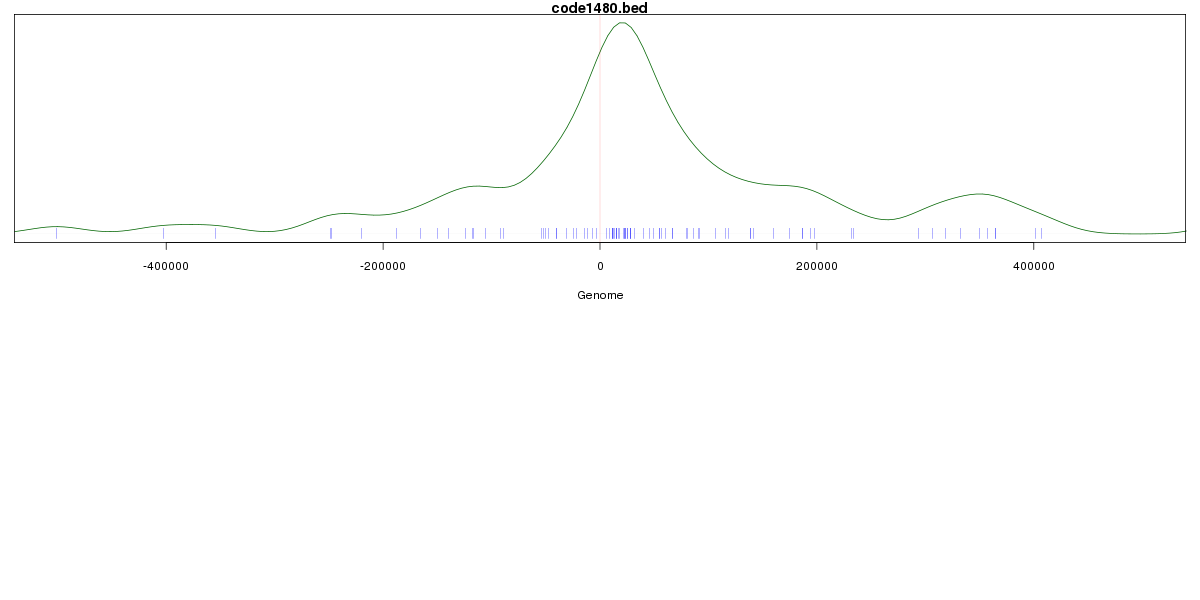
Stats
Number of sites: 176Promoter: 0%
CpG-Island: 0%
Conserved: 34%
Enriched Motifs & Matches
Match Detail: [Jaspar]
|
| ||
|---|---|---|
| Sites: 37/100 | e-val: 0.0000000000000073 | ||
| Factor | e-val(match) | DB |
| RUNX1 | 0.000000031504 | JASPAR |
| ZNF354C | 0.0036613 | JASPAR |
| SOX10 | 0.0041194 | JASPAR |
| RREB1 | 0.017707 | JASPAR |
| SRY | 0.040288 | JASPAR |
BED file downloads
Top 10 Example Regions
| Location | Gene Link | Dist. |
|---|---|---|
| chr12: 76044880-76045030 | RP11-25J3.2 | 48.75 |
| chr8: 16910160-16910310 | MICU3 | 49.18 |
| chr8: 16910160-16910310 | RP11-468H14.2 | 49.18 |
| chr6: 16524640-16524790 | ATXN1 | 49.79 |
| chr12: 15934040-15934190 | EPS8 | 63.76 |
| chr11: 36491780-36491930 | PRR5L | 68.55 |
| chr13: 108111880-108112030 | FAM155A | 69.1 |
| chr10: 60503320-60503470 | BICC1 | 72.37 |
| chr8: 106695480-106695630 | ZFPM2 | 73.92 |
| chr4: 141865400-141865550 | RNF150 | 74.04 |