SOM cluster: 1479
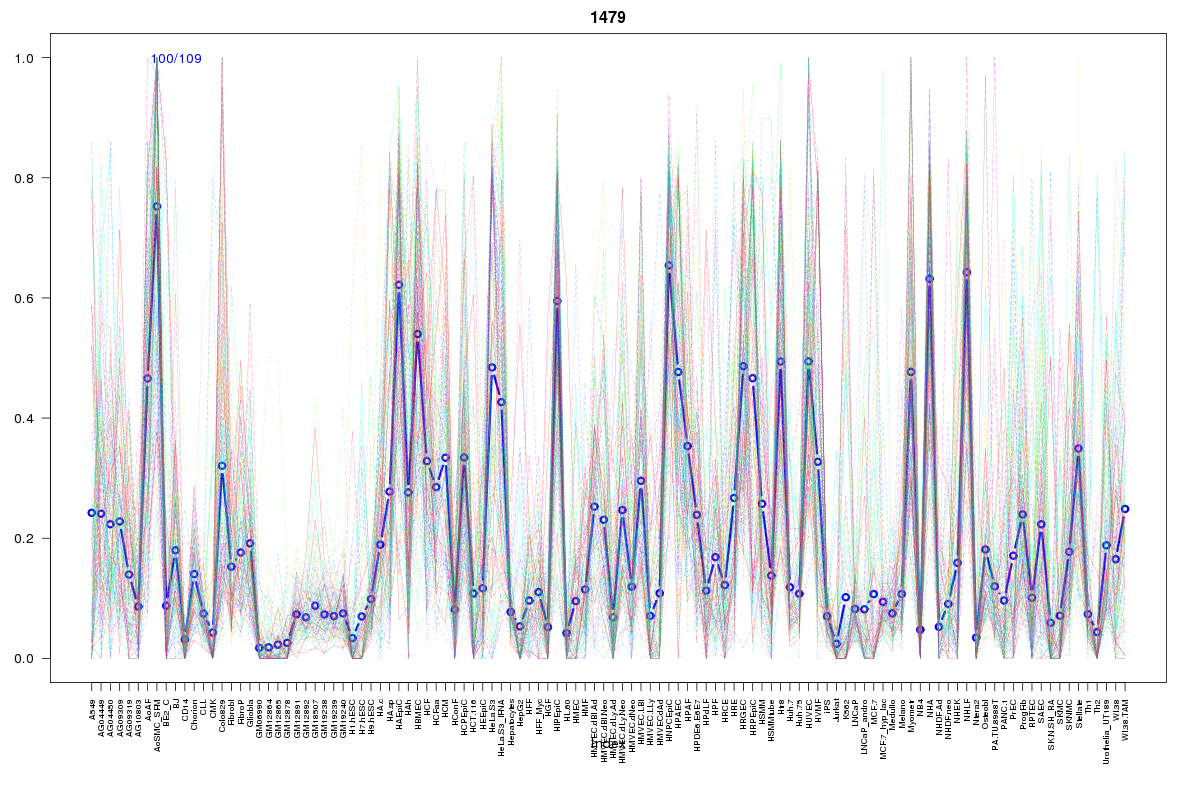
Cluster Hypersensitivity Profile

Genomic Location Trend
These plots show the distribution of the DHS sites surrounding the Transcript Start Site of the nearest gene.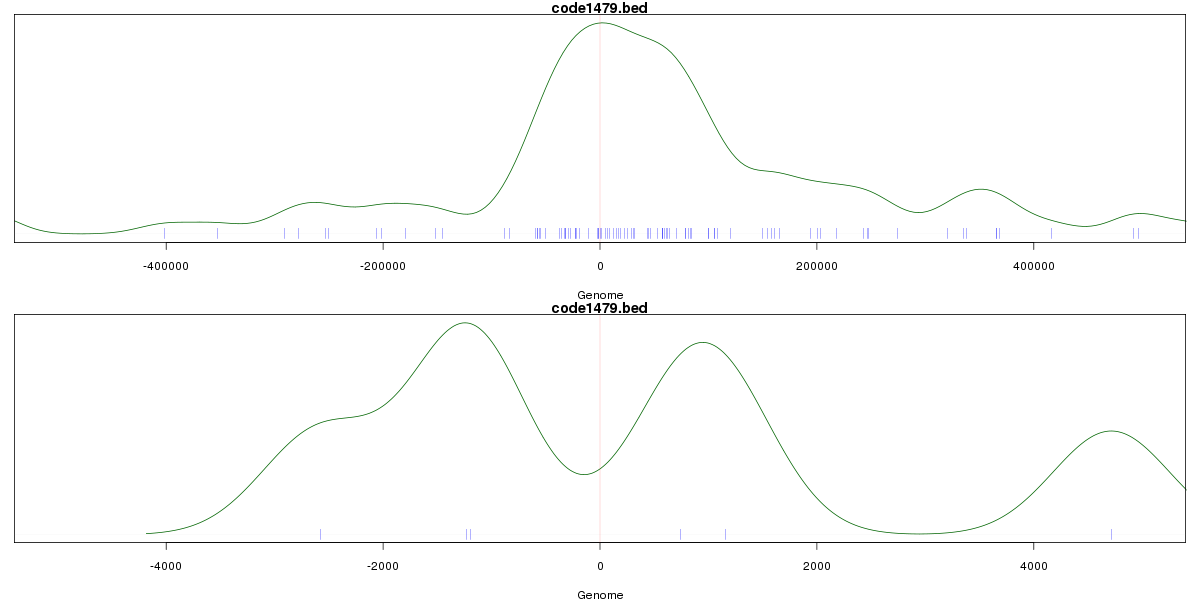
Stats
Number of sites: 109Promoter: 2%
CpG-Island: 0%
Conserved: 42%
Enriched Motifs & Matches
Match Detail: [Jaspar]
|
| ||
|---|---|---|
| Sites: 40/100 | e-val: 0.000000000000058 | ||
| Factor | e-val(match) | DB |
| Gata1 | 0.0000000011658 | JASPAR |
| Evi1 | 0.000000045401 | JASPAR |
| Tal1::Gata1 | 0.000028431 | JASPAR |
| GATA2 | 0.0024109 | JASPAR |
| SRF | 0.0042471 | JASPAR |
|
| ||
| Sites: 45/100 | e-val: 0.0000000000016 | ||
| Factor | e-val(match) | DB |
| AP1 | 0.000000000051095 | JASPAR |
| NFE2L2 | 0.0000000033809 | JASPAR |
| PPARG | 0.0041614 | JASPAR |
| NFE2L1::MafG | 0.0044386 | JASPAR |
| Foxa2 | 0.018518 | JASPAR |
|
| ||
| Sites: 19/100 | e-val: 0.017 | ||
| Factor | e-val(match) | DB |
| MEF2A | 0.00017214 | JASPAR |
| HNF1B | 0.0016397 | JASPAR |
| FOXI1 | 0.0052162 | JASPAR |
| Foxd3 | 0.0054127 | JASPAR |
| HNF1A | 0.0057882 | JASPAR |